
 Yahoo Finanza
 The 6-Month Rally in Stocks Fits History
Since the fall of 2022, stock markets have rallied hard. Popular opinion catered to economic doom and gloom. However, history pointed to better times ahead. Also, one tactical indicator suggested how last September was “go time” for stocks.
Let’s go through the charts.
3 Bullish Charts Betting Against the Bearish Narrative
Should investors be surprised at the latest up move in stocks? We say no. Here are 3 charts that pointed to opportunity for investors.
First, our trusty Big Money Index (BMI) tracks unusual money flows in stocks. Back in late September it crossed the oversold threshold (green below). Those rare events tend to be short-lived and major indexes like the S&P 500 (SPX) are often ripe for a rise:

Second, midterm election years have a strong track record of green markets from November – April. The below chart shows the 6 month returns for the S&P 500 during midterm years going back to 1980.
Notably, the 10 prior instances we green in all cases. The annual returns the following year are enviable too:

Chances are that the market will close out another positive performance for the 2022 – 2023 midterm timeframe.
Third, buying and selling in both stocks and exchange-traded funds (ETFs) suggested unsustainable outflows. Notice how the chunky red bars tend to preface a large up-moves in equity prices:

Those 3 charts pointed to tactical upside in our opinion.
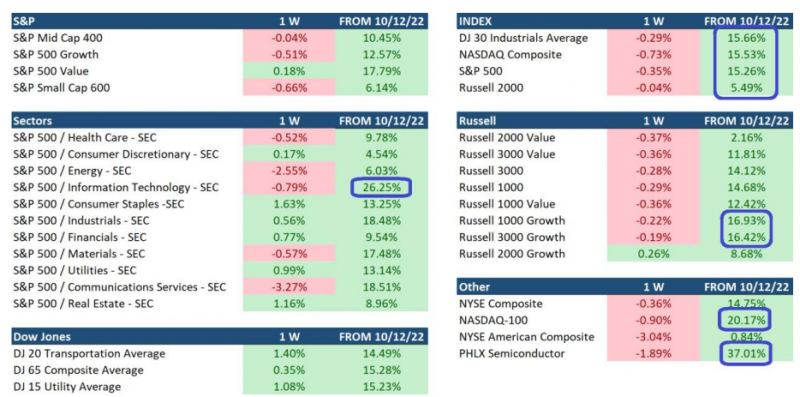
Finally, check out the areas that thrived the most. Below plots the 6- month returns for major themes and sectors. I’ve highlighted the major outperformers: NASDAQ COMP, Information Technology (XLK), Semiconductors (SMH), Russell 1000 Growth (IWF), and Russell 3000 Growth (IWV):
Those moves can be surprising, but that’s how the market works. Sometimes data and history offer another narrative.
The Bottom Line
Markets stunned the crowd. History pointed to upside however. Sometimes looking backwards can inform us, no matter how unpopular it is at the time.
These insights are a truncated view of MAPsignals research which you can learn more here.
Disclosure: As of the time of this writing, the author holds no positions in the ETFs mentioned: XLK, SMH, IWF, IWV at the time of this writing.
This article was originally posted on FX Empire
