
 Yahoo Finanza
 Crude Oil Price Update – Trading on Weak Side of Retracement Zone Resistance at $69.58 – $72.30
U.S. West Texas Intermediate crude oil futures are trading lower on Tuesday after touching their lowest level since September 10 earlier in the session.
After recovering a portion of Friday’s steep loss the previous session, traders were spooked overnight after Moderna’s CEO cast doubt on the efficacy of COVID-19 vaccines against the Omicron coronavirus variant.
The news drove the U.S. benchmark more than 3% lower on renewed worries over oil demand destruction.
The head of drugmaker Moderna told the Financial Times that COVID-19 vaccines are unlikely to be as effective against the Omicron variant of the coronavirus as they have been against the Delta variant.
At 09:56 GMT, January WTI crude oil futures are trading $68.27, down $1.68 or -2.40%.
Daily Swing Chart Technical Analysis
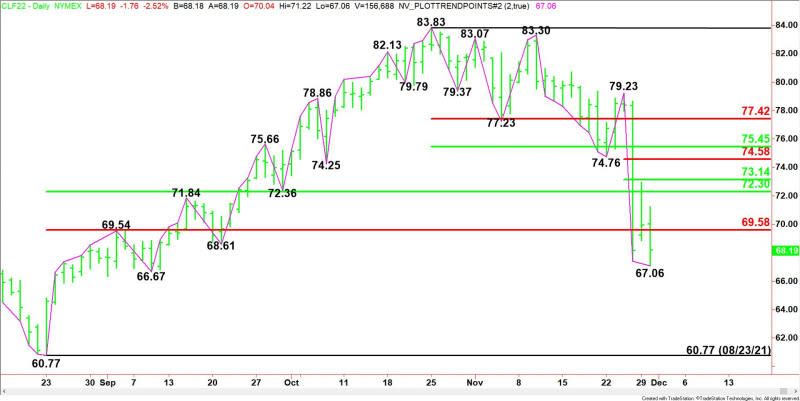
The main trend is down according to the daily swing chart. The downtrend resumed earlier in the session when sellers took out last week’s low at $67.40. A trade through the nearest main bottom at $66.67 will reaffirm the downtrend.
The main trend will change to up on a trade through $79.23. This is highly unlikely, but the steep sell-off suggests only a closing price reversal bottom could shift the momentum.
The main range is $60.77 to $83.83. The market is currently trading on the weak side of its retracement zone at $69.58 to $72.30, making it resistance.
The minor range is $79.23 to $67.06. Its retracement zone at $73.14 to $74.58 is potential resistance.
The short-term range is $83.83 to $67.06. Its retracement zone at $75.45 to $77.42 is additional resistance.
Daily Swing Chart Technical Forecast
The direction of the January WTI crude oil futures contract on Tuesday is likely to be determined by trader reaction to $69.95.
Bearish Scenario
A sustained move under $69.95 will indicate the presence of sellers. Crossing to the weak side of the Fibonacci level at $69.59 will also be a sign of weakness.
Taking out the intraday low at $67.06 will indicate the selling pressure is getting stronger, while a move through the main bottom at $66.67 will reaffirm the downtrend. It is also a potential trigger point for an acceleration to the downside with $60.77 the next target.
Bullish Scenario
A sustained move over $69.95 will signal the presence of buyers. If this creates enough upside momentum then look for a labored rally with potential upside targets a series of retracement levels at $72.30, $73.14, $74.58 and $75.45. Since the main trend is down, look for sellers on a test of these levels.
Side Notes
A close over $69.95 will produce a closing price reversal bottom. If confirmed, this could trigger the start of a 2 to 3 day counter-trend retracement.
For a look at all of today’s economic events, check out our economic calendar.
This article was originally posted on FX Empire
More From FXEMPIRE:
Ethereum Price Prediction – Bulls Eye $4,800 Levels. Avoiding a Fall back to sub-$4,500 Key
PBOC Exec Says NFT, Metaverse Could Become Money-Laundering Tools
Silver Price Daily Forecast – Silver Gains Ground As Dollar Remains Under Pressure
AUD/USD Price Forecast – Australian Dollar Trying To Form a Short-Term Bottom
