
 Yahoo Finanza
 E-mini Dow Jones Industrial Average (YM) Futures Technical Analysis – Focus Shifts to Retail Earnings Reports
June E-mini Dow Jones Industrial Average futures are edging lower early Monday after a tumultuous week ended with a strong recovery rally the previous session, ahead of a big earnings week for retailers.
Friday’s gains came as investors went into relief rally mode to cap off a bad week for stocks in which the benchmark S&P 500 index nearly descended into bear market territory.
At 07:08 GMT, the blue chip average is trading 31947, down 173 or -0.54%. On Friday, the SPDR Dow Jones Industrial Average EFT (DIA) settled at $322.25, up $4.61 or +1.45%.
Retail earnings season kicks off this week with several big-box retailers set to report results for the first quarter, including Dow components Walmart and Home Depot.
Investors will also have their eye on retail sales data this week, which could give them insight into how retailers are managing inflation, which remains near 40-year highs.
Daily Swing Chart Technical Analysis
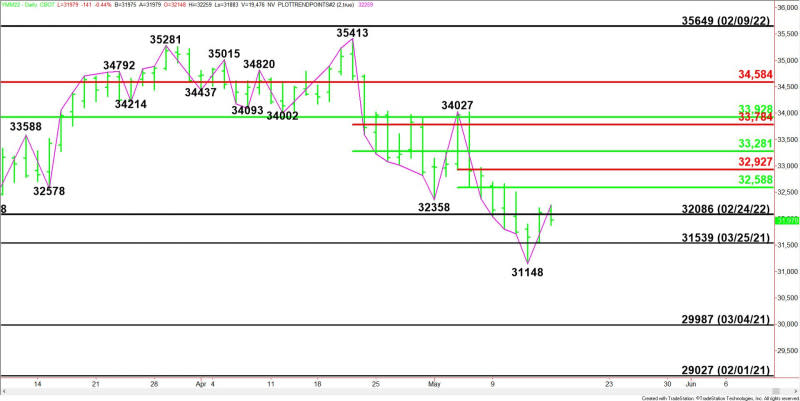
The main trend is down according to the daily swing chart. A trade through 31148 will signal a resumption of the downtrend. A move through 34027 will change the main trend to up.
The minor range is 34027 to 31148. Its retracement zone at 32588 to 32927 is the nearest upside target and potential resistance.
The short-term range is 35413 to 31148. Its retracement zone at 33281 to 33784 is additional resistance.
The major resistance is the price cluster at 33784 to 33928.
Daily Swing Chart Technical Forecast
Trader reaction to 31704 is likely to determine the direction of the June E-mini Dow Jones futures contract early Monday.
Bullish Scenario
A sustained move over 31704 will indicate the presence of buyers. Taking out the intraday high at 32259 will indicate the buying is getting stronger. If this move creates enough upside momentum then look for a surge into the minor retracement zone at 32588 – 32927. Since the main trend is down, look for sellers to re-emerge on the first test of this area.
Bearish Scenario
A sustained move under 31704 will signal the presence of sellers. If this move generates enough downside momentum then look for the selling to possibly extend into the main bottom at 31148. This is a potential trigger point for an acceleration to the downside.
For a look at all of today’s economic events, check out our economic calendar.
This article was originally posted on FX Empire
More From FXEMPIRE:
EU, U.S. raise cooperation to counter Ukraine war disruption
Lukashenko urges Russia-led CSTO military alliance to unite against West
Lebanon’s Hezbollah, allies likely to lose parliamentary majority, sources say
Putin says new military infrastructure in Finland, Sweden would demand reaction
New York supermarket shooting probe to weigh if warning signs were missed
