
 Yahoo Finanza
 E-mini Dow Jones Industrial Average (YM) Futures Technical Analysis – Straddling Key Pivot at 25938
September E-mini Dow Jones Industrial Average futures are trading higher shortly after the opening on Tuesday after trade advisor Peter Navarro clarified that the U.S.-China trade deal is not over. During the pre-market session, the Dow broke sharply after investors misinterpreted Navarro’s comments about U.S.-China trade relations.
“My comments have been taken wildly out of context”, Navarro said in a statement. “They had nothing at all to do with the Phase I trade deal, which continues in place.”
President Trump also tweeted that the existing trade deal remains in place.
At 13:46 GMT, September E-mini Dow Jones Industrial Average futures are trading 26164, up 211 or +0.81%.
Helping to boost the Dow early in the session are components Apple and JPMorgan Chase. Tech giant Apple is up about 1.7% and JPMorgan Chase gained more than 2%.
Daily Swing Chart Technical Analysis
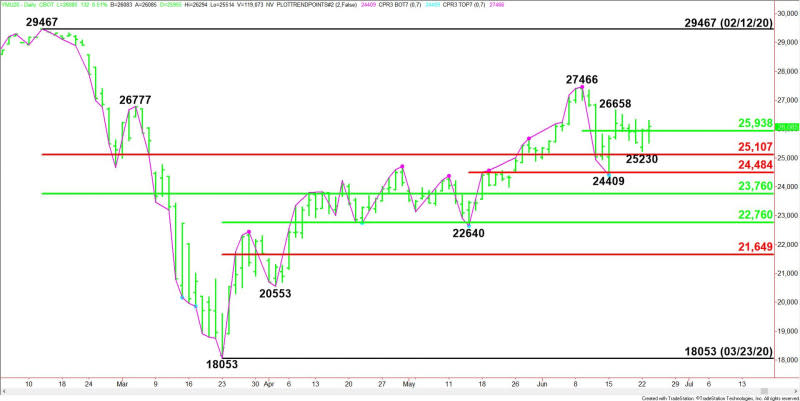
The main trend is up according to the daily swing chart. However, momentum has been trending lower since the formation of the closing price reversal top on June 9.
A trade through 27466 will negate the closing price reversal top and signal a resumption of the uptrend. The main trend will change to down on a trade through 22640.
The minor trend is down. This also confirms the downside momentum. A trade through 26658 will change the minor trend to up.
The minor range is 27466 to 24409. Its 50% level or pivot is 25938.
The short-term range is 22640 to 27466. Its retracement zone at 25053 to 24484 is support.
The main range is 29467 to 18053. Its retracement zone at 25107 to 23760 is the major support. This zone is controlling the longer-term direction of the Dow.
Daily Swing Chart Technical Forecast
Based on the early price action, the direction of the September E-mini Dow Jones Industrial Average the rest of the session on Tuesday is likely to be determined by trader reaction to the minor pivot at 25938.
Bullish Scenario
A sustained move over 25938 will indicate the presence of buyers. If this creates enough upside momentum then look for a surge into the minor top at 26658. Taking out this level could trigger an acceleration into the main top at 27466.
Bearish Scenario
A sustained move under 25938 will signal the presence of sellers. This could trigger a break into a series of levels including a minor bottom at 25230, a main Fibonacci level at 25107 and a short-term 50% level at 25053.
This article was originally posted on FX Empire
More From FXEMPIRE:
GBP/USD Price Forecast – British Pound Continues to Grind Back and Forth
Crude Oil Price Forecast – Crude Oil Markets Filling the Gap
AUD/USD Price Forecast – Australian Dollar Rallies Yet Again
Natural Gas Price Forecast – Natural Gas Markets Find the Floor
USD/JPY Price Forecast – US Dollar Tanks Against Japanese Yen
