
 Yahoo Finanza
 E-mini Dow Jones Industrial Average (YM) Futures Technical Analysis – Move Through 20818 Will Spook the Bears
We’re seeing more divergence between the cash and the futures markets on Thursday. As we said yesterday, this is more of a timing issue. The divergence between the three major indexes, however, indicates that investors are moving money into the tech-weighted NASDAQ Composite Index.
The Dow Jones Industrial Average is the weakest of the three major indexes, but it’s not Walmart’s fault. The big box retailer, a classic defensive consumer staple stock, is benefitting from the millions of Americans stocking up on products for the unknown future. Plus, lower gas prices are relieving pressures from Walmart’s supply chain costs and potentially putting more money in the hands of the U.S. consumer if the coronavirus job losses can be contained, according to CNBC.
At 15:22 GMT, June E-mini Dow Jones Industrial Average futures are trading 19869, up 16 or +0.08%.
During the coronavirus market turmoil, the S&P 500 Index has cratered 25%, while Walmart’s stock is up 2%.
Daily Technical Analysis
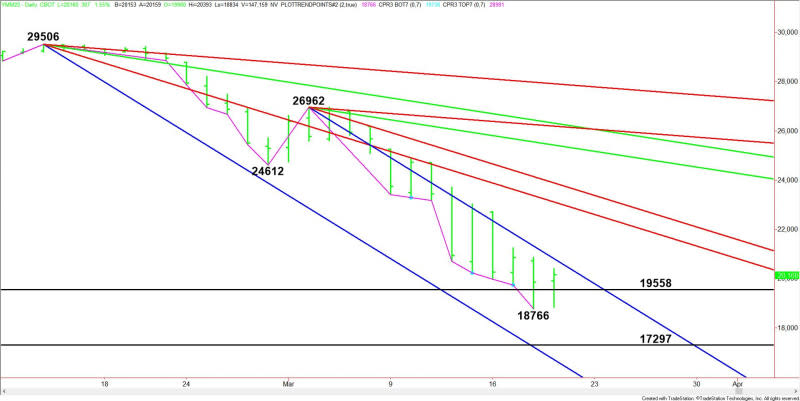
The main trend is down according to the daily swing chart. A trade through 18766 will signal a resumption of the downtrend. The main trend will change to up on a trade through 26962. This is highly unlikely, but there is room for a normal 50% to 61.8% retracement, once momentum shifts to the upside.
Thursday’s inside move could be an indication that the market is beginning to transition from bearish to neutral. Usually, however, it’s just an indication of investor indecision and impending volatility.
Daily Technical Forecast
Most of our focus today is on the downtrending Gann angle at 20818. This angle, dropping at a rate of 512 points per day from the March 3 main top at 26962, has been guiding the market lower for 12 sessions.
Our work shows that a sustained move over this Gann angle could launch a strong short-covering rally. The first two targets today are 23106 and 23890. This two angles are dropping at a rate of 256 points per day.
On the downside, taking out 18766 will indicate the selling is getting stronger and the buying weaker or nonexistent. The next two major downside targets are a main bottom at 17297 and another steep downtrending Gann angle at 16706.
This article was originally posted on FX Empire
