
 Yahoo Finanza
 E-mini Dow Jones Industrial Average (YM) Futures Technical Analysis – Sluggish Ahead of NFP Report
September E-mini Dow Jones Industrial Average futures are inching higher in a lackluster trade on Thursday as investors await the passing of a key fiscal stimulus bill in Congress and ahead of the release of the July U.S. Non-Farm Payrolls figures on Friday. Meanwhile, the latest initial jobless claims report showed 31.3 million Americans were receiving unemployment checks in mid-July.
At 16:56 GMT, September E-mini Dow Jones Industrial Average futures are trading 27120, up 65 or +0.24%.
Daily Swing Chart Technical Analysis
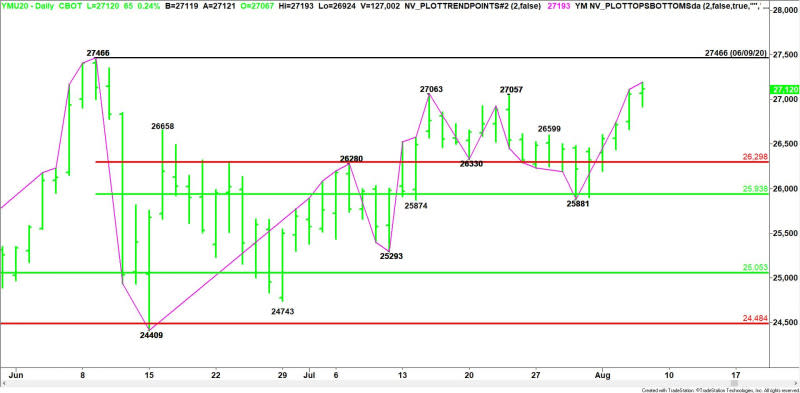
The main trend is up according to the daily swing chart. The uptrend was reaffirmed on Thursday when buyers took out the previous day’s high. The main trend changes to down on a move through the nearest swing bottom at 25881.
The short-term range is 27466 to 24409. Its retracement zone at 26298 to 25938 is controlling the near-term direction of the Dow. This zone is also support.
Daily Swing Chart Technical Forecast
Based on the current price action, the direction of the September E-mini Dow Jones Industrial Average into the close is likely to be determined by trader reaction to yesterday’s close at 27055.
Bullish Scenario
A sustained move over 27055 will indicate the presence of buyers. If this continues to generate enough upside momentum, we could see a short-term test of the June 9 main top at 27466. This is the last major barrier before the all-time high reached in February.
Bearish Scenario
A sustained move under 27055 will signal the presence of sellers. This will also put the Dow in a position to form a potentially bearish closing price reversal top. If confirmed, the chart pattern could trigger the start of a 2 to 3 day correction, or a minimum 50% retracement of the current rally.
For a look at all of today’s economic events, check out our economic calendar.
This article was originally posted on FX Empire
More From FXEMPIRE:
ViacomCBS Posts Better-Than-Expected Q2 Revenue on Robust Streaming Demand; Target Price $35
E-mini NASDAQ-100 Index (NQ) Futures Technical Analysis – Supported by Jump in Facebook Shares
USD/CAD Daily Forecast – U.S. Dollar Rebounds After Sell-Off
Gold Price Prediction – Prices Rise as the Dollar Falls Despite Solid Claims Numbers
