
 Yahoo Finanza
 E-mini Dow Jones Industrial Average (YM) Futures Technical Analysis – Could See Futures/Cash Divergence
September E-mini Dow Jones Industrial Average futures are trading higher but struggling to hold on to gains shortly before the cash market close. The cash market Dow is actually trading lower, creating a divergence with the broader-based S&P 500 and NASDAQ Composite.
Helping to weigh on sentiment were Dow components Microsoft and Apple which slid on Friday. Meanwhile, the blue chip average was supported by strength in the utilities and healthcare sectors.
At 19:47 GMT, September E-mini Dow Jones Industrial Average futures are at 26581, up 28 or +0.11%. The cash market Dow is trading 26712.43, down 22.28 or -0.09%. Both are still in a position to close higher for the week.
The price action suggests investors are moving into protective mode until we get more information on a COVID-19 vaccine and how long the coronavirus is going to affect us long term. There’s not really a lot of selling pressure just profit-taking and position-trimming. There is also a rotation going on from expensive large-cap growth tech stocks into more reasonably valued securities.
Daily Swing Chart Technical Analysis
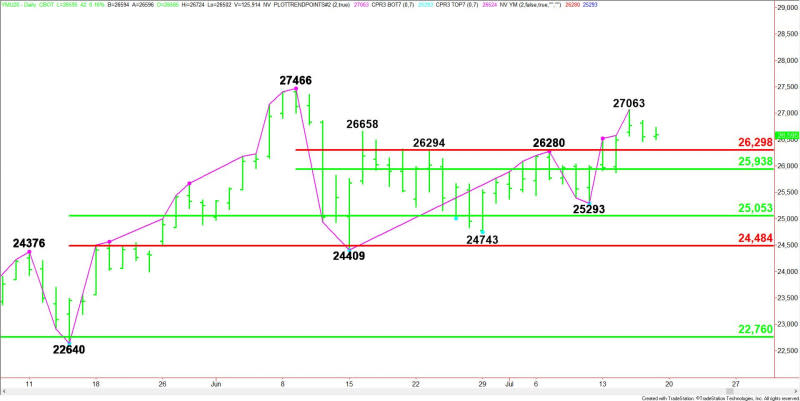
The main trend is up according to the daily swing chart. A trade through 27063 will signal a resumption of the uptrend. The main trend will change to down on a trade through 25293.
The minor trend is also up. It will change to down on a trade through the nearest minor bottom at 25874. This will shift momentum to the downside.
The short-term range is 27466 to 24409. Its retracement zone at 26298 to 25938 is support.
The main range is 22640 to 27466. If the main trend changes to down then its retracement zone at 25053 to 24484 will become the primary downside target zone.
Short-Term Outlook
There is no daily or weekly closing price reversal top to work with so we are assuming that we’re going through a traditional short-term correction.
The tone of the market over the next term is likely to be determined first by trader reaction to the Fibonacci level at 26298. Holding above it will indicate that buyers are still coming in to support the uptrend.
If the selling is strong enough to take out 26298 but the Dow still hold above 25938 then this will create a more neutral atmosphere.
Sentiment will turn a little bearish if the 50% level at 25938 fails as support. There is room to the downside under this level so don’t be surprised by a steep sell-off.
This article was originally posted on FX Empire
More From FXEMPIRE:
EOS, Ethereum and Ripple’s XRP – Daily Tech Analysis – July 18th, 2020
EUR/USD Weekly Price Forecast – The Euro Continues to Grind Higher
US Stock Market Overview – Stocks Close Mixed for the Day and the Week
Crude Oil Price Forecast – Crude Oil Markets Continue to Put Traders to Sleep
S&P 500 Weekly Price Forecast – Stock Markets Form Major Potential Bullish Signal
S&P 500 Price Forecast – Stock Markets Continue to See Bullish Pressure
