
 Yahoo Finanza
 E-mini Dow Jones Industrial Average (YM) Futures Technical Analysis – Buyers Defending 25144 Fibonacci Level
June E-mini Dow Jones Industrial Average futures are trading higher late afternoon on Friday after a successful challenge of yesterday’s low. The market bounced between losses and gains as bargain hunting following sharp losses a day earlier were offset by continued worries about the economy. Despite Friday’s rally, the Dow was still in a position to post a potentially bearish closing price top and it was on track for its worst week in nearly three months.
At 10:17 GMT, June E-mini Dow Jones Industrial Average futures were trading 25534, up 369 or +1.47%.
The Federal Reserve’s indication on Wednesday of a long road to recovery and rising COVID-19 cases in the United States have cast a pall over investor bets on a swift economic rebound.
Daily Swing Chart Technical Analysis
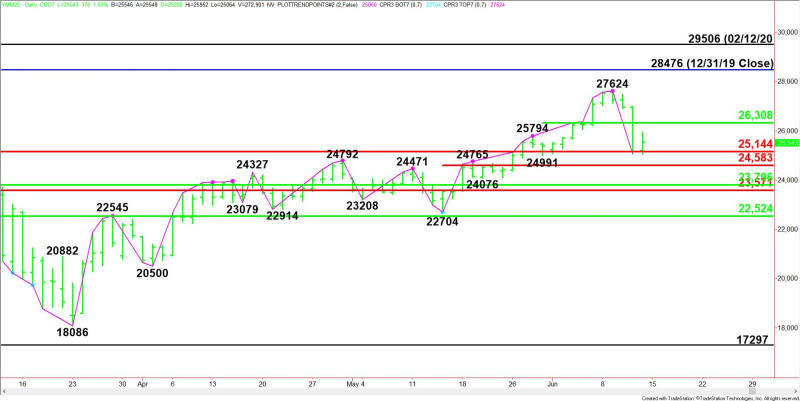
The main trend is up according to the daily swing chart, however, momentum has been trending lower since the formation of the closing price reversal top on June 9.
A trade through 27624 will negate the reversal top and signal a resumption of the uptrend. A move through 22704 will change the main trend to down.
The minor trend is up. A trade through 24991 will change the minor trend to down. This will also shift momentum to the downside.
The minor range is 24991 to 27624. Its 50% level at 26308 is resistance.
The main range is 22704 to 27624. Its retracement zone at 25164 to 24583 is a potential support area.
The major range is 29506 to 18086. Its retracement zone at 25144 to 23796 is controlling the longer-term direction of the Dow.
Short-Term Outlook
Based on the price action the last two sessions, buyers are trying to defend 25144. This is important because this means there is still hope for another run at new highs.
A break under 25144 will indicate the buying is getting weak and the selling is getting stronger. This may lead to a test of the 50% level at 23796. It is possible that the Dow becomes rangebound inside 23796 to 25144.
The selling could really accelerate if 23796 fails as support. In my opinion, this sis the potential trigger point for an acceleration to the downside.
We’re not going to be sure if a top is in until we see the formation of a secondary lower top. This would create an “M” formation.
The first move down from a top is usually long liquidation. The formation of a secondary lower top is where the short sellers come in.
For a look at all of today’s economic events, check out our economic calendar.
This article was originally posted on FX Empire
