
 Yahoo Finanza
 E-mini Dow Jones Industrial Average (YM) Futures Technical Analysis – Weak Under 35679, Strong Over 35908
December E-mini Dow Jones Industrial Average futures finished slightly lower on Wednesday as investors moved back into technology shares, pressuring industrials and financials.
In economic news, the so-called core PCE price index, the Federal Reserve’s preferred inflation measure, also accelerated in October. Other data showed weekly jobless claims fell and third-quarter GDP was revised higher, while a University of Michigan survey showed consumer sentiment improved in November.
On Wednesday, December E-mini Dow Jones Industrial Average futures settled at 35749, down 17 or -0.05%.
In other news, various Federal Reserve policymakers said they would be open to speeding up elimination of their bond-buying program and move more quickly to raise interest rates if high inflation held, minutes of the U.S. central bank’s last policy meeting showed.
Daily Swing Chart Technical Analysis
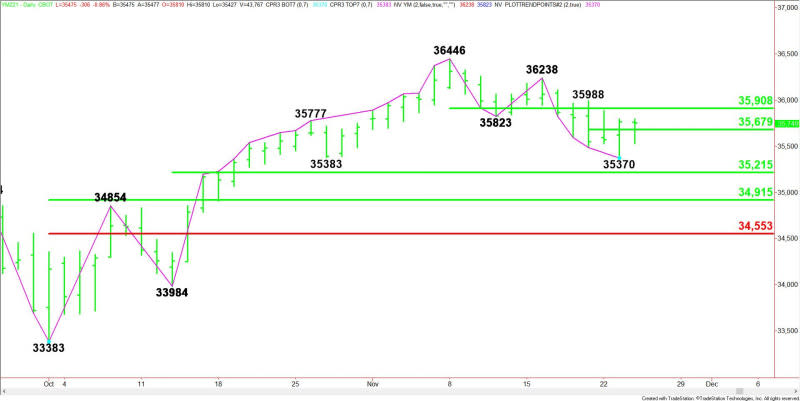
The main trend is down according to the daily swing chart. A trade through 35370 will signal a resumption of the downtrend. A move through 36238 will change the main trend to up.
The minor trend is also down. A trade through 35370 will indicate the selling is getting stronger. A move through 35988 will change the minor trend to up and shift momentum to the upside.
The minor range is 35988 to 35370. The E-mini Dow closed on the strong side of its pivot at 35679, making it potential support.
The short-term range is 36446 to 35370. Its 50% level at 35908 is potential resistance.
On the downside, the nearest support is 35315. This is followed by the best support zone at 34915 – 34553. A test of this area could bring in new buyers.
Daily Swing Chart Technical Forecast
The direction of the December E-mini Dow Jones Industrial Average early Friday is likely to be determined by trader reaction to 35679.
Bullish Scenario
A sustained move over 35679 will indicate the presence of buyers. If this move creates enough upside momentum then look for a surge into 35908.
Taking out the minor top at 35988 will shift momentum to the upside. This could trigger an acceleration into the main top at 36238. A move through this level will change the main trend to up.
Bearish Scenario
A sustained move under 35679 will signal the presence of sellers. If this generates enough downside momentum then look for a break into 35370.
A trade through 35370 will indicate the selling is getting stronger. This could trigger a further break into the 50% level at 35215. If this level fails then look for an acceleration into the retracement zone at 34915 to 34553. Look for buyers on a test of this zone.
For a look at all of today’s economic events, check out our economic calendar.
This article was originally posted on FX Empire
