
 Yahoo Finanza
 E-mini NASDAQ-100 Index (NQ) Futures Technical Analysis – Strengthens Over 13773.00, Weakens Under 13592.25
June E-mini NASDAQ-100 Index futures are trading flat-to-lower ahead of key U.S. economic data due to be released on Thursday and Friday.
A weekly unemployment report and May private payrolls data on Thursday will be followed by monthly jobs numbers on Friday, with investors looking for signs of an economic rebound and rising inflation.
At 07:37 GMT, June E-mini NASDAQ-100 Index futures are trading 13663.25, down 10.50 or -0.08%.
Concerns about whether inflation could prompt action by the Federal Reserve have consumed markets in recent weeks. Philadelphia Fed Bank President Patrick Harker said that as the U.S. economy continues to recover from the coronavirus crisis and the labor market rebounds, it may be time for Fed policymakers to start thinking about the best way to slow the pace of its asset purchases.
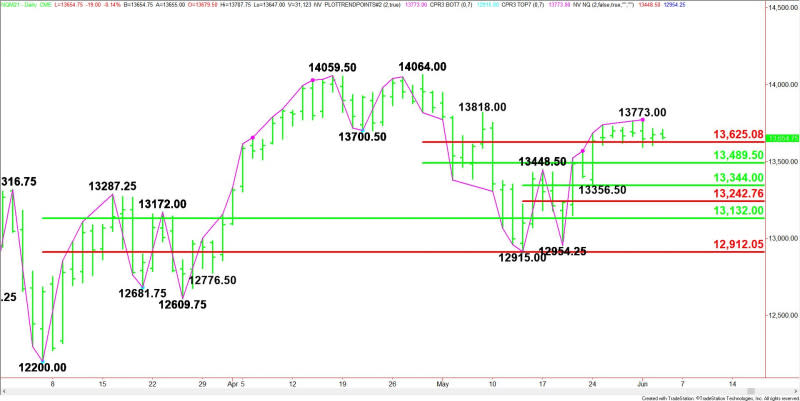
Daily Swing Chart Technical Analysis
The main trend is up according to the daily swing chart, however, the price action earlier this week suggests momentum may be getting ready to shift to the downside following the formation of a closing price reversal top on Tuesday.
A trade through 13773.00 will negate the closing price reversal top and signal a resumption of the uptrend. Taking out 13592.25 will confirm the closing price reversal top, shifting momentum to the downside.
The minor trend is also up. A trade through 13356.50 will change the minor trend to down. This will confirm the shift in momentum.
The short-term range is 14064.00 to 12915.00. Its retracement zone at 13625.00 to 13489.50 is support.
The minor range is 12915.00 to 13773.00. Its retracement zone at 13344.00 to 13242.75 is a potential support area.
Daily Swing Chart Technical Forecast
The direction of the June E-mini NASDAQ-100 Index on Thursday is likely to be determined by trader reaction to 13625.00.
Bullish Scenario
A sustained move over 13625.00 will indicate the presence of buyers. This could trigger a rally into the closing price reversal top at 13773. Taking out this level could drive the index into a minor top at 13818.00. This is a potential trigger point for an acceleration to the upside.
Bearish Scenario
A sustained move under 13625.00 will signal the presence of sellers. Taking out 13592.25 will confirm the closing price reversal top and could trigger an acceleration to the downside with the short-term 50% level at 13489.50 the next likely target.
For a look at all of today’s economic events, check out our economic calendar.
This article was originally posted on FX Empire
