
 Yahoo Finanza
 E-mini NASDAQ-100 Index (NQ) Futures Technical Analysis – Main Trend Up, but Momentum Shifted to Downside
March E-mini NASDAQ-100 Index futures are trading sharply lower at the mid-session as investors book profits on stocks with high valuation, which have underpinned the U.S. stock market since its March 2020 lows.
Shares of Apple Inc, Microsoft Corp, Amazon.com Inc, Tesla Inc and Alphabet Inc were down between 0.8% and 2.0%. Facebook Inc shares slipped 1.3% as Wall Street assessed the wider ramifications of its move to block all news content in Australia.
At 17:10 GMT, March E-mini NASDAQ-100 Index futures are trading 13506.25, down 193.50 or -1.41%.
In other news, an unexpected rise in weekly jobless claims pointed to a fragile recovery in the labor market. The Labor Department’s report showed initial claims for state employment benefits were 861,000 last week, compared with 848,000 in the prior week, partly due to potential claims related to the temporary closure of automobile plants due to a global semiconductor chip shortage.
Daily Swing Chart Technical Analysis
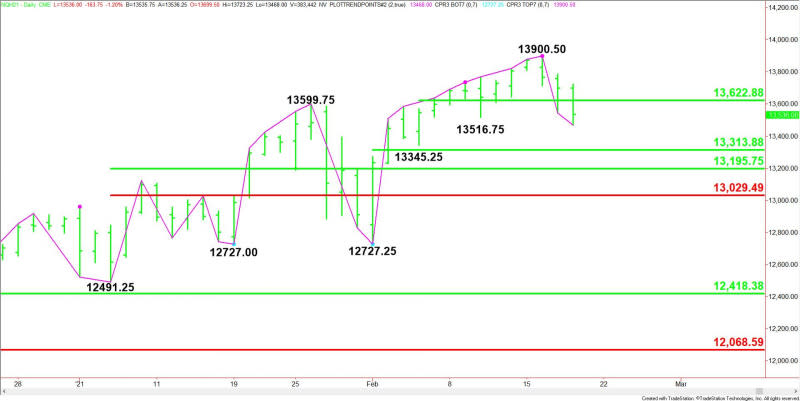
The main trend is up according to the daily swing chart, but momentum has been trending lower since the formation of the closing price reversal top on Tuesday.
A trade through 13900.50 will negate the closing price reversal top and signal a resumption of the uptrend. A move through 12727.25 will change the main trend to down.
The minor trend is down. This confirms the shift in momentum. The trade through 13516.75 changed the minor trend to down. This is followed by the next minor bottom at 13345.25.
The minor range is 13345.25 to 13900.50. The index is currently trading on the weak side of its 50% level at 13623.00.
The short-term range is 12727.25 to 13900.50. Its 50% level at 13313.75 is the first downside target.
The main range is 12491.25 to 13900.50. Its retracement zone at 13195.75 to 13029.50 is the primary downside target zone.
Daily Swing Chart Technical Forecast
The early price action suggests the direction of the index into the close will be determined by trader reaction to the pivot at 13623.00.
Bearish Scenario
A sustained move under 13622.75 will indicate the presence of sellers. A sustained move under 13516.75 will indicate the selling pressure is getting stronger. This could trigger an acceleration into 13345.25 and 13313.75.
If 13313.75 fails then look for the selling to possibly extend into 13195.75 to 13029.50.
Bullish Scenario
Overcoming 13623.00 later in the session will signal the return of buyers. This could trigger a quick move into 13684.25, followed by the record high at 13900.50.
For a look at all of today’s economic events, check out our economic calendar.
This article was originally posted on FX Empire
