
 Yahoo Finanza
 E-mini NASDAQ-100 Index (NQ) Futures Technical Analysis – Close Under 16575.00 Forms Reversal Top
December E-mini NASDAQ-100 Index futures are trading lower at the mid-session on Monday after reaching a record high earlier in the session. Traders appear to be taking profits after President Joe Biden picked Federal Reserve Chair Jerome Powell to lead the central bank for a second term.
At 17:22 GMT, December E-mini NASDAQ-100 Index futures are trading 16485.75, down 89.25 or -0.54%. This is down from an intraday high at 16767.50.
Technology shares are being pressured because of the rise in Treasury yields. Powell’s first term was driven by lower interest rates, which tend to be good news for technology companies. During his second term, the Fed is expected to raise rates which could increase expenses for technology firms.
Daily Swing Chart Technical Analysis
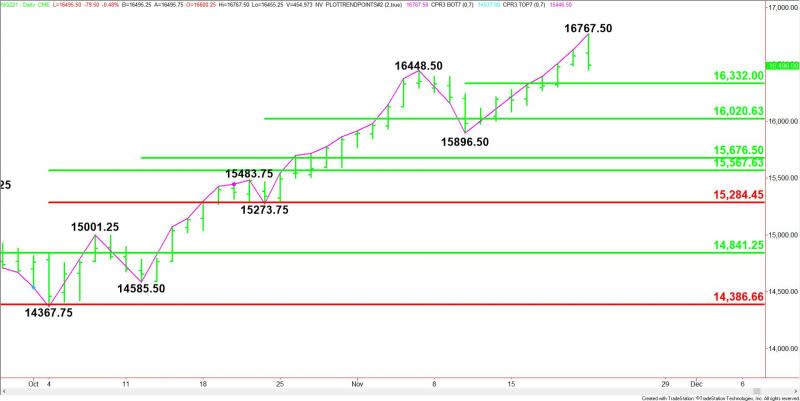
The main trend is up according to the daily swing chart. The uptrend was reaffirmed earlier in the session. Taking out the intraday high at 16767.50 will reestablish the uptrend.
A move through 15896.50 will change the main trend to down. This is highly unlikely, but the index is currently in a position to post a potentially bearish closing price reversal top. This won’t change the main trend to down, but it could trigger the start of a 2 to 3 day correction.
The minor range is 15896.50 to 16767.50. Its 50% level or pivot at 16332.00 is the nearest downside target. This is followed by another pivot at 16020.50.
If the main trend changes to down then look for a potential break into 15567.50 to 15284.50.
Daily Swing Chart Technical Forecast
The direction of the December E-mini NASDAQ-100 Index into the close on Monday is likely to be determined by trader reaction to 16575.00.
Bearish Scenario
A sustained move under 16575.00 will indicate the presence of sellers. If this move creates enough downside momentum then look for the selling to possibly extend into 16332.00.
Look for a technical bounce on the first test of 16332.00. If it fails to hold then look for an acceleration to the downside with the next targets 16020.50, followed by the main bottom at 15896.50.
Bullish Scenario
A sustained move over 16575.00 will signal the presence of buyers. If this move generates enough upside momentum then look for a possible retest of 16767.50. This is a potential trigger point for an acceleration to the upside.
Side Notes
A close under 16575.00 will form a closing price reversal top. If confirmed on Tuesday, this could trigger the start of a 2 to 3 day correction.
For a look at all of today’s economic events, check out our economic calendar.
This article was originally posted on FX Empire
