
 Yahoo Finanza
 E-mini NASDAQ-100 Index (NQ) Futures Technical Analysis – Trading on Strong Side of Retracement Zone Support
June E-mini NASDAQ-100 Index futures are trading higher shortly after the midsession on Friday as investors showed little reaction to a surge in inflation last month.
A key inflation indicator, the core personal consumption expenditures index (PCE), rose 3.1% in April, faster than expectations of a 2.9% increase but not as hot as many on Wall Street had feared. Meanwhile, the savings rate remained elevated at 14.9% last month, while consumer spending rose 0.5%, in line with estimates.
At 18:03 GMT, June E-mini NASDAQ-100 Index futures are at 13716.50, up 51.00 or +0.37%.
NASDAQ components Dell Technologies Inc and HP Inc reported quarterly revenue that beat Wall Street estimates but their shares fell 1.7% and 8%, respectively after they warned that the ongoing computer chip shortage could impact its ability to meet demand for laptops this year.
Daily Swing Chart Technical Analysis
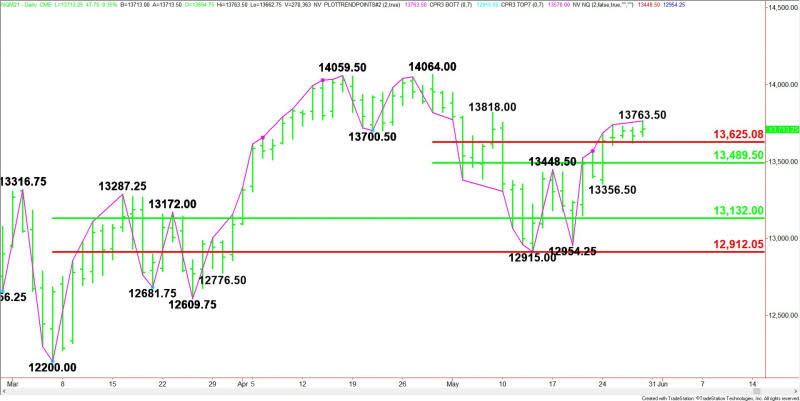
The main trend is up according to the daily swing chart. A trade through the intraday high at 13763.50 will signal a resumption of the uptrend. A move through 12954.25 will change the main trend to down.
The minor trend is also up. A trade through 13356.50 will change the minor trend to down. This will shift momentum to the downside.
The short-term range is 14064.00 to 12915.00. Its retracement zone at 13625.00 to 13489.50 is support. The index is currently trading on the strong side of this zone, giving it an upside bias.
Daily Swing Chart Technical Forecast
The direction of the June E-mini NASDAQ-100 Index on Friday is likely to be determined by trader reaction to 13665.50.
Bullish Scenario
A sustained move over 13665.50 will indicate the presence of buyers. If this move generates enough upside momentum then look for a possible breakout over 13763.50 late in the session. This could trigger an acceleration into the next minor top at 13818.00.
Bearish Scenario
A sustained move under 13665.50 will signal the presence of sellers. The first downside target is the Fibonacci level at 13625.00. If this fails then look for a possible acceleration into the short-term 50% level at 13489.50.
Side Notes
Volatility and volume are on the light side ahead of the long U.S. holiday weekend so be careful buying strength and selling weakness into the close. It’ll be easy to get trapped in a whipsaw trade.
For a look at all of today’s economic events, check out our economic calendar.
This article was originally posted on FX Empire
More From FXEMPIRE:
Crude Oil Weekly Price Forecast – Crude Oil Markets Threatening Breakout
The Weekly Wrap – Economic Data and Central Bank Chatter Influenced in the Week
Silver Weekly Price Forecast – Silver Continues to Struggle With Break Out
Crude Oil Price Forecast – Crude Oil Continues to Press Top of Triangle
Natural Gas Price Forecast – Natural Gas Markets Rally to End The Week
S&P 500 Price Forecast – Stock Markets Gap Higher to Kick Off Friday Session
