
 Yahoo Finanza
 E-mini NASDAQ-100 Index (NQ) Futures Technical Analysis – Trend Changes to Down on Trade Through 12727.25
March E-mini NASDAQ-100 Index futures are trading sharply lower late Thursday as surging U.S. Treasury yields took the shine off stocks now that a strong economic recovery looked more certain and investors clung to concerns that inflation would rise.
The benchmark 10-year note yield surged more than 20 basis points to a one-year high above 1.6%. That surge put the 10-year interest rate above the 1.48% S&P 500 dividend yield, wiping out the strong advantage that the stock market has held over bonds during the pandemic.
At 20:03 GMT, March E-mini NASDAQ-100 Index futures are trading 12896.00, down 406.00 or -3.05%.
Higher rates tend to hit the technology sector especially hard as the group relies on easy borrowing for superior growth. Additionally, investors are rotating out of high-flying technology shares and into areas of the market that would benefit from an economic reopening the most.
Daily Swing Chart Technical Analysis
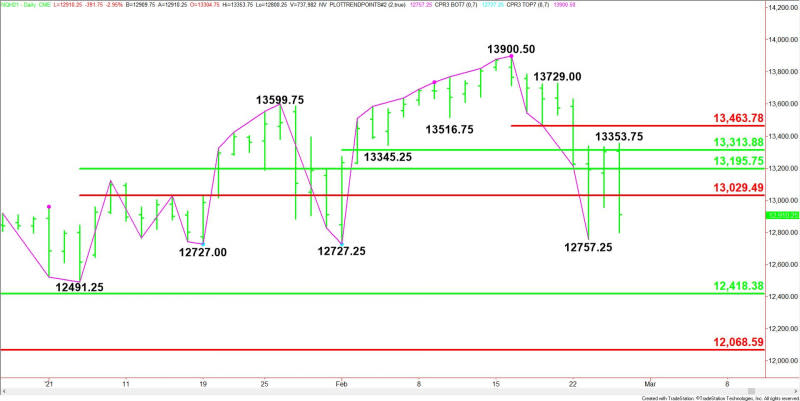
The main trend is up according to the daily swing chart, however, momentum is trending lower. The main trend will change to down on a move through 12727.25, followed closely by another main bottom at 12727.00. Taking out 12727.00 will reaffirm the downtrend with 12491.25 the next likely downside target. A move through 13900.50 will signal a resumption of the uptrend.
The minor trend is down. This is controlling the downside momentum. A trade through 13353.75 will change the minor trend to up. This will shift momentum to the upside.
The short-term range is 12491.25 to 13900.50. The index is currently trading on the weak side of its retracement zone at 13029.50 to 13195.75, making it resistance.
On the downside, the major support zone is 12418.25 to 12068.50.
Short-Term Outlook
The key level to watch into the close is 13029.50. Trading on the weak side of this level will put the index in a bearish position.
Taking out the minor bottom at 12727.25 will indicate the selling is getting stronger. A move through 12727.25 and 12727.00 will reaffirm the downtrend with 12491.25 to 12418.25 the next likely downside target zone.
Overcoming 13029.50 will signal the return of buyers. This could lead to a labored rally with potential resistance levels coming in at 13195.75, 13314.00 and 13353.75.
For a look at all of today’s economic events, check out our economic calendar.
This article was originally posted on FX Empire
