
 Yahoo Finanza
 E-mini NASDAQ-100 Index (NQ) Futures Technical Analysis – New Support Moves Up to 13786.00
June E-mini NASDAQ-100 Index futures finished slightly higher on Friday. The index hit a new record high during the session, but it was a struggle with tech behemoths Apple Inc, Amazon.com Inc, Tesla Inc and Microsoft Corp, slipping between 0.2% and 1.5%. In the cash market, the technology-heavy NASDAQ Composite finished less than one percent below its own all-time closing high achieved on February 12.
On Friday, June E-mini NASDAQ-100 Index futures settled at 14029.50, up 15.50 or +0.11%.
The Federal Reserve’s pledge to keep interest rates low despite inflation has also revived demand for richly valued technology stocks, although bond yields edged higher again on Friday after hitting multi-week lows a day earlier.
Daily Swing Chart Technical Analysis
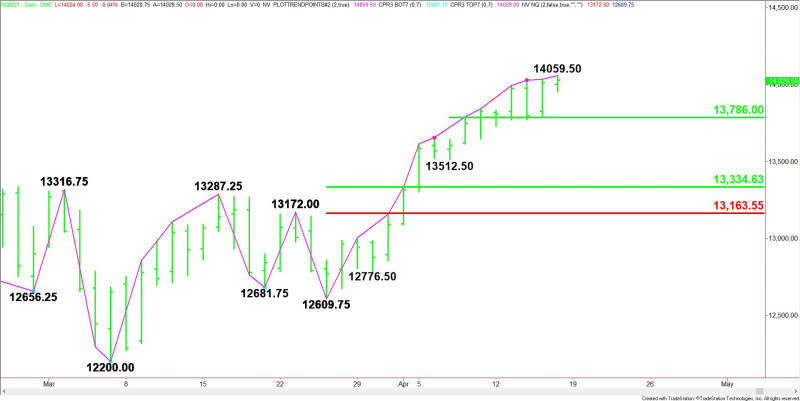
The main trend is up according to the daily swing chart. The uptrend was reaffirmed on Friday when buyers took out Thursday’s high at 14034.25.
A trade through 12609.75 will change the main trend to down. This is highly unlikely, but due to the prolonged move up in terms of price and time, the index closed on Friday inside the window of time for a potentially bearish closing price reversal top.
The minor trend is also up. A trade through 13512.50 will change the minor trend to down. This will also shift momentum to the downside.
The minor range is 13512.50 to 14059.50. Its 50% level at 13786.00 is the nearest support.
The main range is 12609.75 to 14059.50. If the minor trend changes to down then look for the selling to possibly extend into its retracement zone at 13334.50 to 13165.50.
Short-Term Outlook
The uptrend is very strong and it’s going to take some time to change the main trend to down. However, a higher-high, lower-close will be the first sign of selling pressure. The formation of a closing price reversal top chart pattern will give investors an early warning to start trimming long positions.
Some aggressive traders will choose to use this chart pattern as a shorting opportunity. This will be much better than trying to pick a top. However, keep in mind that a closing price reversal top does not change the trend. It only indicates the selling is greater than the buying at current price levels.
The daily chart currently indicates that a combination of a closing price reversal top and a sustained move under 13786.00 could trigger the start of a steep break with 13334.50 the minimum objective.
For a look at all of today’s economic events, check out our economic calendar.
This article was originally posted on FX Empire
More From FXEMPIRE:
Ethereum, Litecoin, and Ripple’s XRP – Daily Tech Analysis – April 19th, 2021
Wall Street Closes Higher Friday as S&P 500, Dow Hit Record Highs
Crude Oil Price Update – Strengthens Over $63.47, Weakens Under $62.29
E-mini NASDAQ-100 Index (NQ) Futures Technical Analysis – New Support Moves Up to 13786.00
