
 Yahoo Finanza
 E-mini NASDAQ-100 Index (NQ) Futures Technical Analysis – Trade Though 12019 Confirms Reversal Top
December E-mini NASDAQ-100 Index futures are trading lower shortly before the close on Tuesday, putting it in a position to post a potentially bearish closing price reversal top. The chart pattern won’t indicate a change in trend, but if confirmed, it could trigger the start of a 2 to 3 day correction of the recent rally.
After confirming the uptrend early in the session on the hope of additional stimulus and a positive outlook for the third quarter earnings, the index turned lower for the day after Johnson & Johnson took a pause in its current vaccine study. The surprise news encouraged investors to trim long positions, fueling the intraday sell-off.
At 20:58 GMT, December E-mini NASDAQ-100 Index futures are trading 12079.00, down 19.25 or -0.16%.
In other news, Apple Inc slipped 1.1% ahead of a virtual event starting at 1700 GMT where it is widely expected to unveil four new iPhone models.
Meanwhile, Amazon.com Inc shares, which have already surged 86% this year, added 1% as the company began 48 hours of promotions as part of “Prime Day” in an early start to the holiday shopping season.
Daily Swing Chart Technical Analysis
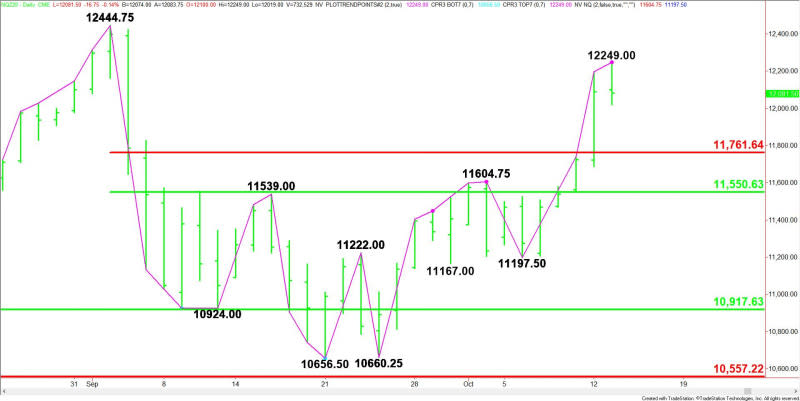
The main trend is up according to the daily swing chart. The uptrend was confirmed early Tuesday. A trade through 12249.00 will signal a resumption of the uptrend. The main trend will change to down on a move through 11197.50.
The short-term range is 12444.75 to 10656.50. Its retracement zone at 11761.50 to 11550.50 is support. This zone is controlling the near-term direction of the index. It is also the nearest support area.
Short-Term Forecast
On Tuesday, the December E-mini S&P 500 Index posted a potentially bearish closing price reversal top. A trade through 12019 will confirm the chart pattern. This won’t change the main trend to down, but it could trigger the start of a two to three day correction with 11723.25 the primary downside target.
A move through 12249.00 will negate the chart pattern and signal a resumption of the uptrend. This could create the upside momentum needed to challenge the all-time high at 12444.75.
For a look at all of today’s economic events, check out our economic calendar.
This article was originally posted on FX Empire
More From FXEMPIRE:
Crude Oil Price Update – $40.63 to $41.50 Retracement Zone Controls Near-Term Direction
Natural Gas Price Prediction – Prices Ease Despite Cold Weather Forecast
Gold Price Prediction – Gold Eases Rejecting the Latest Breakout
AUD/USD Forex Technical Analysis – Trader Reaction to .7170 Sets Early Tone
