
 Yahoo Finanza
 E-mini NASDAQ-100 Index (NQ) Futures Technical Analysis – Early Challenge on Thursday Will Be 15861.00 Pivot
December E-mini NASDAQ-100 Index futures are trading lower after the cash market close on Wednesday, extending their losses and adding to Tuesday’s selloff which snapped the NASDAQ Composite’s eight session run of all-time closing highs.
The selling is being fueled by fears of an earlier than expected rate hike by the Federal Reserve after the U.S. Labor Department reported a hotter-than-expected jump in the consumer price index (CPI). Consumer prices rose 0.9% in October, helping to fuel its fastest year-on-year gain in 31 years.
At 21:09 GMT, December E-mini NASDAQ-100 Index futures are at 15967.00, down 245.75 or -1.52%. This is up from an intraday low of 15896.50.
In stock related news, Tesla Inc bucked the trend with a 2.2% gain, reversing several sessions of declines in the wake of CEO Elon Musk’s polling Twitter users on whether he should sell 10% of his stake in the company he founded.
Daily Swing Chart Technical Analysis
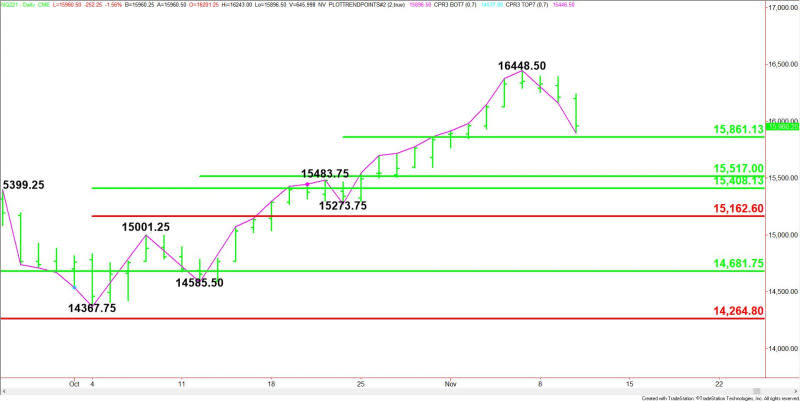
The main trend is up according to the daily swing chart. A trade through 16448.50 will signal a resumption of the uptrend. A move through 15273.75 will change the main trend to down.
The short-term range is 15273.75 to 16448.50. Its 50% level or pivot at 15861.00 is the first downside target.
The second short-term range is 14585.50 to 16448.50. Its 50% level or pivot provides additional support at 15517.00.
The third short-term range is 14367.75 to 16448.50. Its retracement zone at 15408.00 to 15162.50 is a value area that could attract new buyers.
Daily Swing Chart Technical Forecast
The direction of the December E-mini NASDAQ-100 Index into the close and on the opening Thursday will be determined by trader reaction to 15861.00.
Bullish Scenario
A sustained move over 15861.00 will indicate the presence of buyers. If this creates enough upside momentum then look for a surge back to 16172.50. Overcoming this level will indicate the buying is getting stronger. This could lead to a retest of 16448.50.
Bearish Scenario
A sustained move under 15861.00 will signal the presence of sellers. This could trigger an acceleration to the downside with potential targets a series of retracement levels at 15517.00, 15408.00 and 15162.50.
Since the trend is up, look for buyers on a test of these levels especially the value zone at 15408.00 to 15162.50.
For a look at all of today’s economic events, check out our economic calendar.
This article was originally posted on FX Empire
