
 Yahoo Finanza
 E-mini NASDAQ-100 Index (NQ) Futures Technical Analysis – Trade Through 12096.75 Shifts Momentum to Upside
June E-mini NASDAQ-100 Index futures fell on Tuesday as fears from Snap’s bleak warning spread to other tech names.
Shares of tech companies led the day’s losses as investors feared a slowdown in digital advertising following a warning from social media company Snap. Its shares plummeted 43% after the company said it’s bracing to miss earnings and revenue targets in the current quarter and warned of a downturn in hiring.
On Tuesday, June E-mini NASDAQ-100 Index futures settled at 11771.00, down 264.25 or -2.24%. The Invesco QQQ Trust ETF (QQQ) finished at $287.25, down $6.23 or -2.12%.
Meta Platforms followed Snap lower, falling 7.6%. Google-parent Alphabet dropped nearly 5% and hit a new 52-week low.
Daily Swing Chart Technical Analysis
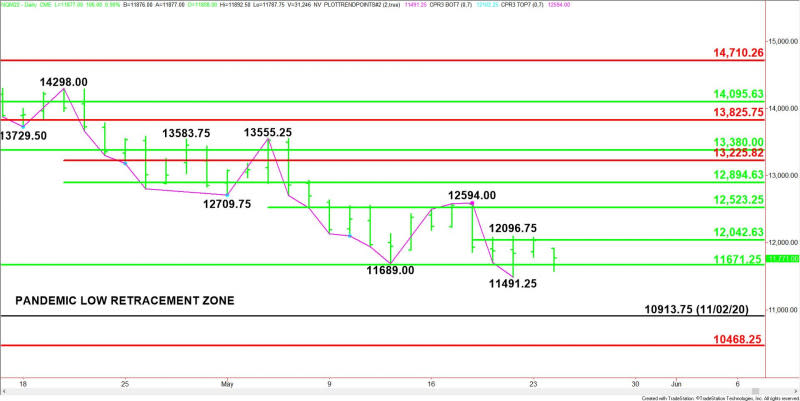
The main trend is down according to the daily swing chart. A trade through 11491.25 will signal a resumption of the downtrend. A move through 12594.00 will change the main trend to up.
The minor trend is also down. A trade through 12096.75 will change the minor trend to up. This will shift momentum to the upside.
The nearest support is the long-term 50% level at 11671.25. This is followed by the long-term Fibonacci level at 10468.25.
The minor range is 12594.00 to 11491.25. Its pivot at 12042.75 is the first resistance.
The short-term range is 13555.25 to 11491.25. Its pivot at 12523.25 is additional resistance.
Daily Swing Chart Technical Forecast
Trader reaction to 11671.25 is likely to determine the direction of the June E-mini NASDAQ-100 Index early Wednesday.
Bullish Scenario
A sustained move over 11671.25 will indicate the presence of counter-trend buyers. This could trigger a surge into the minor pivot at 12042.75, followed closely by the minor top at 12096.75.
Taking out 12096.75 will shift momentum to the upside. If the move is strong enough then look for the rally to possibly extend into 12523.25, followed closely by 12594.00. Overtaking this price will change the main trend to up.
Bearish Scenario
A sustained move under 11671.25 will signal the presence of sellers. The first target is the minor bottom at 11491.25. This is a potential trigger point for an acceleration to the downside with the November 2, 2020 main bottom at 10913.75 the next key target price.
For a look at all of today’s economic events, check out our economic calendar.
This article was originally posted on FX Empire
More From FXEMPIRE:
Kiwi soars on hawkish RBNZ, greenback bounces from 1-month low
Japan to ensure swift recovery from pandemic with relief steps -finance minister
Factbox-Power of Trump’s endorsements faces test in 12 U.S. midterm primaries
New Zealand raises interest rates 50 bps, signals more aggressive hikes
South Korea, U.S. security advisers hold talks after N.Korea fires salvo of missiles
