
 Yahoo Finanza
 E-mini NASDAQ-100 Index (NQ) Futures Technical Analysis – Trader Reaction to 13708.50 Sets the Tone on Weds
March E-mini NASDAQ-100 Index futures are trading lower shortly before the close on Tuesday as traders reacted to a jump in U.S. Treasury yields. Earlier in the session, the index reached a record high on the prospect of more fiscal aid to lift the U.S. economy from a coronavirus-driven slump.
The index was also pressured as investors moved out of technology stocks while moving money into cyclical stocks, which are expected to strengthen as the U.S. economy recovers.
At 21:39 GMT, March E-mini NASDAQ-100 Index futures are trading 13750.00, down 54.75 or -0.40%.
Treasury yields move sharply higher on Tuesday, with the 10-year Treasury yielding hitting a level not seen since February 2020.
The technology sector includes many stocks with high earnings multiples, which may also come under pressure with rising yields, according to some market analysts.
Daily Swing Chart Technical Analysis
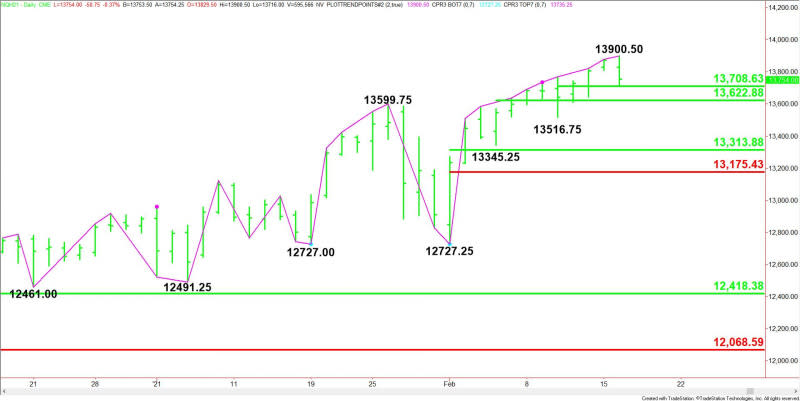
The main trend is up according to the daily swing chart, but the chart pattern suggests momentum may be getting ready to shift to the downside. A trade through 13900.50 will signal a resumption of the uptrend.
Taking out 12727.25 will change the main trend to down. This is highly unlikely but due to the prolonged move up in terms of price and time, the index is ripe for a potentially bearish closing price reversal top.
The minor trend is also up. A trade through 13516.75 will change the minor trend to down. This will also shift momentum to the downside.
The first minor range is 13516.75 to 13900.50. Its 50% level at 13708.50 is the first downside target.
The second minor range is 23345.25 to 13900.50. Its 50% level at 13622.75 is the second potential downside target.
The third minor range is 12727.25 to 13900.50. If the minor trend changes to down then look for the selling to possibly extend into 13313.75 to 13175.50.
Short-Term Outlook
A close under 13872.00 will form a closing price reversal top. If this chart pattern is confirmed on Wednesday then look for the start of a 2 to 3 day correction.
The first target is 13708.50. Taking out his level will indicate the selling pressure is getting stronger. This could trigger a further break into 13622.75, followed by the minor bottom at 13516.75.
If 13516.75 is taken out then look for a potential acceleration to the downside with 13313.75 to 13175.50 the next likely downside target.
For a look at all of today’s economic events, check out our economic calendar.
This article was originally posted on FX Empire
More From FXEMPIRE:
European Equities: A Light Economic Calendar Leaves U.S Stats to Test Investor Sentiment
SP 500 Price Forecast – Stock Markets Continue to Look to the Upside
USD/CAD Daily Forecast – U.S. Dollar Rebounds After Yesterday’s Sell-Off
Natural Gas Price Prediction – Prices Rally on Strong Spot Demand
EOS, Stellar’s Lumen, and Tron’s TRX – Daily Analysis – February 17th, 2021
