
 Yahoo Finanza
 E-mini NASDAQ Reaction to 14144 Sets Tone into Close
March E-mini NASDAQ-100 Index futures are trading lower shortly after the mid-session on Tuesday amid another sell-off in technology firms ahead of the Federal Reserve’s policy announcements on Wednesday.
The fourth-quarter earnings season has started off on a mixed note, with all eyes now on mega-cap growth company Microsoft earnings after the market close on Tuesday, followed by Apple and Tesla later this week.
At 18:57 GMT, March E-mini NASDAQ-100 Index futures are trading 14245.00, down 256.00 or 1.77%. The Invesco QQQ Trust Series 1 ETF (QQQ) is at $347.38, down $5.92 or -1.68%. Both markets are trading inside Monday’s range, which suggests investor indecision and impending volatility.
The Fed will announce it policy statement on Wednesday at 19:00 GMT, which will be watched closely for cues on the central bank’s timeline for hiking key interest rates to combat inflation. Fed funds futures traders are pricing in a 25 basis points hike in March, in addition to three more rate increases by the end of the year.
Daily Swing Chart Technical Analysis
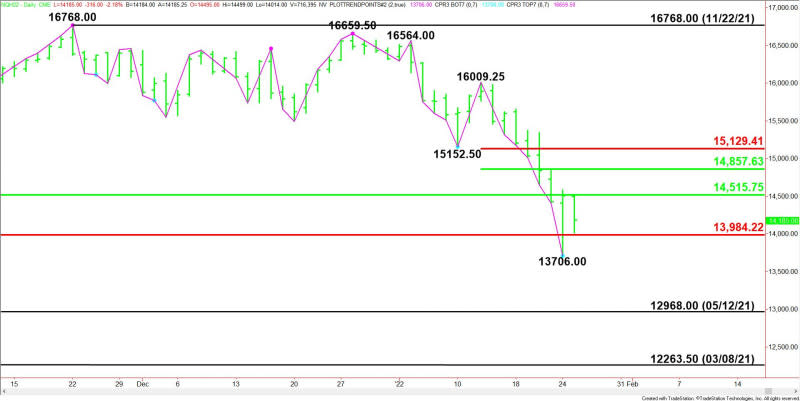
The main trend is down according to the daily swing chart. A trade through 16009.25 will change the main trend to up.
On Monday, the index formed a potentially bullish closing price reversal bottom. A trade through 14582 will confirm the chart pattern. This could trigger the start of a 2 to 3 day counter-trend rally. A move through 13706.00 will negate the chart pattern and signal a resumption of the downtrend.
The main range is 12263.50 to 16768.00. The index is currently trading inside its retracement zone at 14515.75 to 13984.25.
The minor range is 16009.25 to 13706.00. Its retracement zone at 14857.75 to 15129.50 is the first upside target zone.
Daily Swing Chart Technical Forecast
The direction of the March E-mini NASDAQ-100 Index into the close on Tuesday is likely to be determined by trader reaction to 14144.
Bullish Scenario
A sustained move over 14144 will indicate the presence of buyers. If this creates enough upside momentum then look for a surge into 14515.75, followed by 14582.00.
Taking out 14582.00 could trigger an acceleration into 14857.75 to 15129.50 over the near-term.
Bearish Scenario
A sustained move under 14144 will signal the presence of sellers. If this generates enough downside momentum then look for a break into 13984.25, followed by 13706.00. The latter is a potential trigger point for an acceleration into 12968.00.
For a look at all of today’s economic events, check out our economic calendar.
This article was originally posted on FX Empire
