
 Yahoo Finanza
 E-mini S&P 500 Index (ES) Futures Technical Analysis – Early Strength Over 2986.00, Weakness Under 2983.50
September E-mini S&P 500 Index futures are inching higher Monday after clawing back earlier losses. Despite the slight gain, investor focus remains on the surge in coronavirus cases in the U.S., which are stoking concerns about the economic reopening and recovery.
Ahead of the cash market opening at 14:30 GMT, investors are watching the latest COVID-19 numbers. Data compiled by Johns Hopkins University showed more than 2.5 million cases have been confirmed across the U.S.
Additionally, Health and Human Services Secretary Alex Azar warned on Sunday that the “window is closing” for the U.S. to curb the coronavirus outbreak.
At 02:04 GMT, September E-mini S&P 500 Index futures are trading 3014.50, up 7.50 or +0.25%.
Daily Swing Chart Technical Analysis
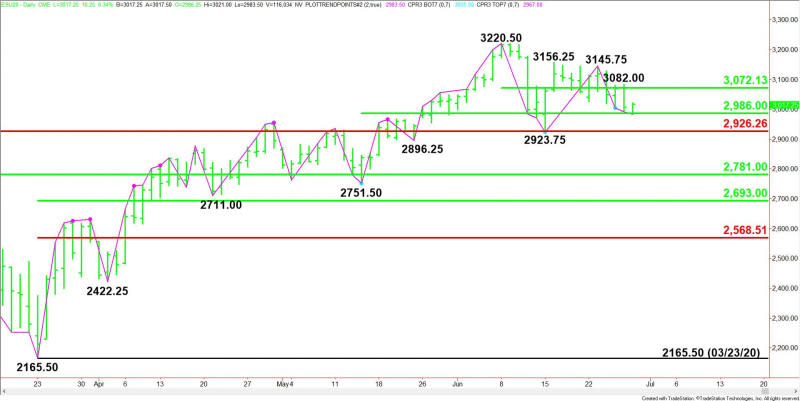
The main trend is up according to the daily swing chart, however, momentum is trending lower. A trade through 3145.75 will signal a resumption of the uptrend, followed by another main top at 3220.50. The main trend will change to down on a move through 2923.75.
The minor trend is down. This is controlling the momentum. A trade through 3082.00 will change the minor trend to up.
The formation of the secondary lower top at 3145.75 is another sign of increasing selling pressure.
The first short-term range is 3220.50 to 2923.75. Its 50% level at 3072.25 is resistance.
The second short-term range is 2751.50 to 3220.50. Its 50% level at 2986.00 is potential support.
The main retracement zone is 2926.25 to 2781.00 is the major support zone. This zone is controlling the longer-term direction of the index.
Short-Term Outlook
Early in the session on Monday, buyers showed some respect for the 50% level at 2986.00, mounting their turnaround after touching 2983.50. We’re going to be watching the 2986.00 to 2983.50 area throughout the session as we move toward the cash market opening.
A sustained move over 2986.00 will indicate the presence of buyers. If this move can create enough upside momentum throughout the session, then look for the intraday rally to possibly extend into 3072.25. That’s the nearest resistance.
The inability to even approach 3072.25 will indicate the buying is getting weaker, or the selling pressure stronger.
Crossing to the weak side of the 50% level at 2986.00 will signal the presence of sellers. Taking out the intraday low at 2983.50 could trigger an acceleration into the next support cluster at 2926.25 to 2923.75.
For a look at all of today’s economic events, check out our economic calendar.
This article was originally posted on FX Empire
