
 Yahoo Finanza
 E-mini S&P 500 Index (ES) Futures Technical Analysis – Trade Through 3065.50 Signals Resumption of Uptrend
June E-mini S&P 500 Index futures are trading flat-to-lower shortly before the cash market opening. Earlier in the session, the benchmark index traded a little better as investors shrugged off the violent protests in the United States over the weekend.
A strong performance in Asia may have underpinned the index early. Continuing to underpin the market is increasing optimism by traders that the global economy will successfully reopen after the coronavirus pandemic forced the shutdown of most economic activity.
At 10:33 GMT, June E-mini S&P 500 Index futures are trading 3032.50, down 9.50 or -0.31%.
After gaining 4.5% in May, investors will be trying to match or beat that performance this month. Investors will be watching the reopening of more state economies, while monitoring the simmering tensions between the United States and China.
On Monday, traders will get the opportunity to react to the latest U.S. ISM Manufacturing PMI data at 14:00 GMT. It is expected to come in at 43.5, up from 41.5, but still below the key 50 level.
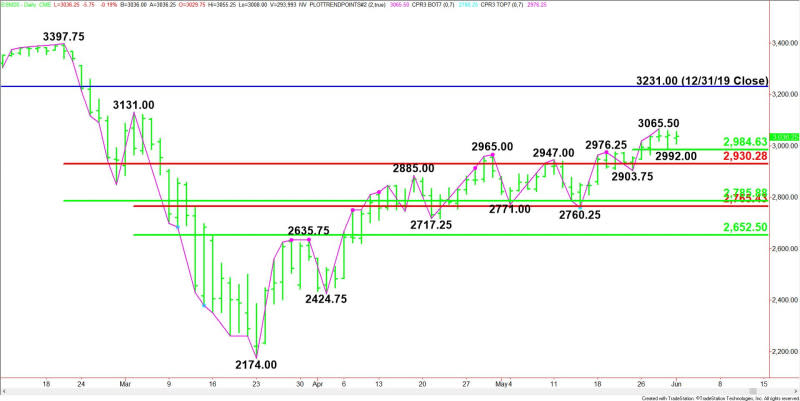
Daily Swing Chart Technical Analysis
The main trend is up according to the daily swing chart. A trade through 3065.50 will signal a resumption of the uptrend. The main trend will change to down on a move through 2903.75.
The minor trend is also up. The minor trend will change to down on a trade through 2992.00. This will also shift momentum to the downside.
The minor range is 2903.75 to 3065.50. Traders are trying to form a support base at its 50% level at 2984.50.
The main range is 3397.75 to 3174.00. Its retracement zone at 2930.25 to 2785.75 is controlling the longer-term direction of the index. Its upper or Fibonacci level at 2930.25 is potential support.
Daily Swing Chart Technical Forecast
Based on the price action the last three sessions, the key level to watch today is 2984.50.
Bullish Scenario
Holding above 2984.50 will indicate the presence of buyers. If this move can create enough upside momentum then look for a possible drive into 3065.50. Taking out this level will reaffirm the uptrend with 3131.00 the next major upside target.
Bearish Scenario
A sustained move under 2984.50 will signal the presence of sellers. This could trigger a break into the major Fibonacci level at 2930.25, followed by the main bottom at 2903.75.
For a look at all of today’s economic events, check out our economic calendar.
This article was originally posted on FX Empire
More From FXEMPIRE:
Oil Price Fundamental Weekly Forecast – Traders Eyeing Russia’s Response to Output Cut Extension
Manufacturing PMIs Put the EUR and USD in Focus as Demand for Riskier Assets Rises
European Equities: Geopolitics and Manufacturing PMIs in Focus
Southwest Airlines Poised to Move Higher With Domestic Bookings Picking Up Steam
