
 Yahoo Finanza
 E-mini S&P 500 Index (ES) Futures Technical Analysis – Holding 3072.00 Sets Tone; Breakout Over 3145.75
September E-mini S&P 500 Index futures are trading higher shortly before the release of the U.S. Non-Farm Payrolls report and the cash market opening.
The closely-watched monthly employment report for June, set to be released at 12:30 GMT, has proven difficult for market watchers to forecast of late, CNBC wrote. Last month, economists forecast a loss of 8 million jobs in May and the economy gained 2.5 million payrolls instead.
The June report is expected to show the economy added 3 million jobs, as companies rehired workers they let go when the economy shut down. Consensus estimates also forecast the unemployment rate falling to 12.4% from 13.3% in May.
At 12:10 GMT, September E-mini S&P 500 Index futures are trading 3126.75, up 23.75 or +0.77%.
Traders will also be monitoring the Weekly Jobless Claims report, which will give Wall Street a better grasp of how many are still collecting unemployment benefits.
Daily Swing Chart Technical Analysis
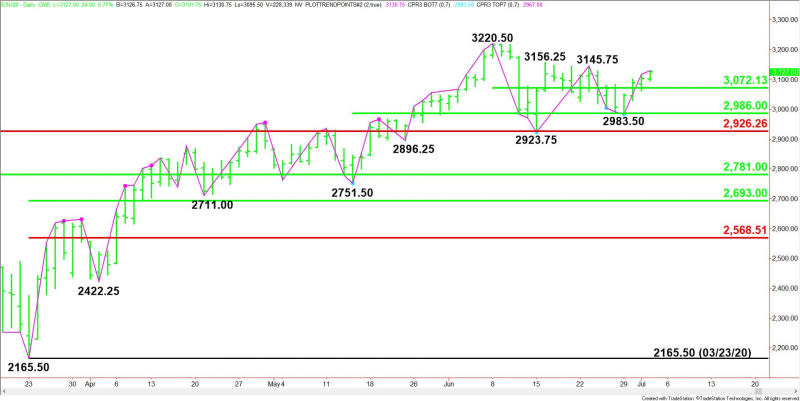
The main trend is up according to the daily swing chart. A trade through 3145.75 will signal a resumption of the uptrend. The main trend changes to down on a trade through 2983.50.
The first short-term range is 3220.50 to 2923.75. Its 50% level at 3072.00 is potential support.
The second short-term range is 2751.50 to 3220.50. Its 50% level at 2986.00 is additional support.
The first major support is the Fibonacci level at 2926.25.
Daily Swing Chart Technical Forecast
Based on the early price action and the current price at 3126.75, the direction of the September E-mini S&P 500 Index the rest of the session on Thursday is likely to be determined by trader reaction to the 50% level at 3072.00.
Bullish Scenario
A sustained move over 3072.00 will indicate the presence of buyers. If this continues to generate enough upside momentum then look for a test of 3145.75. Taking out this level should lead to a test of 3156.25. This is a potential trigger point for an acceleration to the upside with the next target the main top at 3220.50.
Bearish Scenario
A sustained move under 3072.00 will signal the presence of sellers. This could trigger an acceleration to the downside with the support cluster at 2986.00 to 2983.50 the next likely downside target. This is followed by another support cluster at 2926.25 to 2923.75.
The main bottom at 2923.75 is a potential trigger point for an acceleration to the downside with the next major target the 50% level at 2781.00.
For a look at all of today’s economic events, check out our economic calendar.
This article was originally posted on FX Empire
