
 Yahoo Finanza
 E-mini S&P 500 Index (ES) Futures Technical Analysis – Reaction to 3238.00 Sets the Tone
September E-mini S&P 500 Index futures are trading lower shortly after the cash market opening. Helping to push the benchmark index to the negative side is a mixed batch of earnings reports from blue-chip companies. Traders are also monitoring the start of negotiations between Republican and Democratic lawmakers over a new fiscal stimulus deal.
At 14:09 GMT, September E-mini S&P 500 Index futures are trading 3225.25, down 7.00 or -0.23%.
Shortly before the opening, 3M Company reported it fell short of estimates on quarterly profit and revenue, hurt by a plunge in demand across its business units.
McDonald’s Corp fell 2.1% after posting a bigger-than-expected drop in global same-store sales and missing profit expectations as its restaurants were shut due to the pandemic.
Pfizer Inc rose 3.1% after it raised its full-year forecast on strong demand for cancer drug and blood thinner. Late on Monday, the drug maker announced a pivotal global study to evaluate a COVID-19 vaccine candidate.
Daily Swing Chart Technical Analysis
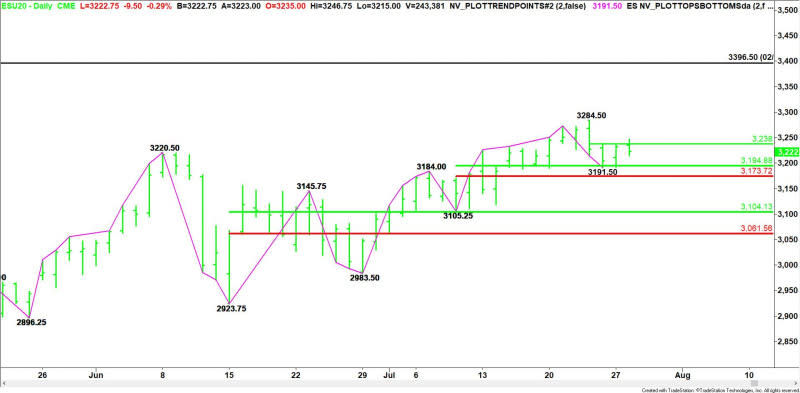
The main trend is up according to the daily swing chart, but momentum is trending lower. A trade through 3284.50 will signal a resumption of the uptrend. The main trend will change to down on a trade through 3105.25.
The minor trend is also down. This is controlling the downside momentum. A new minor bottom was formed at 3191.50. Taking out this level will indicate the selling is getting stronger.
The minor range is 3284.50 to 3191.50. Its 50% level or pivot at 3238.00 is acting like resistance today.
The short-term range is 3105.25 to 3284.50. Its retracement zone at 3194.75 to 3173.75 is potential support. If it fails, then look for an acceleration to the downside.
Daily Swing Chart Technical Forecast
Based on the early price action, the direction of the September E-mini S&P 500 Index the rest of the session on Tuesday is likely to be determined by trader reaction to the minor pivot at 3238.00.
Bearish Scenario
A sustained move under 3238.00 will indicate the presence of sellers. If this creates enough downside momentum, then look for the selling to extend into a series of levels at 3194.75, 3191.50 and 3173.75.
Taking out 3173.75 could trigger an acceleration to the downside with the next target a support cluster at 3105.25 to 3104.00.
Bullish Scenario
Overtaking 3238.00 and sustaining the rally could trigger an acceleration to the upside with 3284.50 the next target. This is a potential trigger point for an even steeper climb.
Visa, Advanced Micro Devices, Amgen, eBay, Mondelez International and Starbucks report after the bell on Tuesday.
For a look at all of today’s economic events, check out our economic calendar.
This article was originally posted on FX Empire
