
 Yahoo Finanza
 EUR/USD Mid-Session Technical Analysis for July 6, 2020
The Euro is trading higher against the U.S. Dollar after a huge stock market rally in China triggered a rise in demand for higher-yielding assets, dampening the dollar’s appeal as a safe-haven investment. The single-currency was also boosted by strong Euro Zone retail sales data.
At 10:44 GMT, the EUR/USD is trading 1.1291, up 0.0051 or +0.46%.
Consumers in the Euro Zone returned en masse to shops in May as lockdowns were eased in the bloc, estimates from the EU statistics agency showed on Monday, signaling a sharp recovery of sales after record drops in March and April, Reuters reported.
Sales in the 19 countries sharing the Euro Zone rose by 17.8% in May from April, Eurostat said, in the steepest increase since Euro Zone records for retail sales began in 1999. The rise was higher than market expectations of a 15% increase on the month.
Compared to a year earlier, sales were still down 5.1% in May, showing the recovery is far from complete. But the year-on-year drop was less steep than the 7.5% fall forecast by economists polled by Reuters.
Among the largest Euro Zone countries, retail sales went up by 13.9% in Germany and by 25.6% in France.
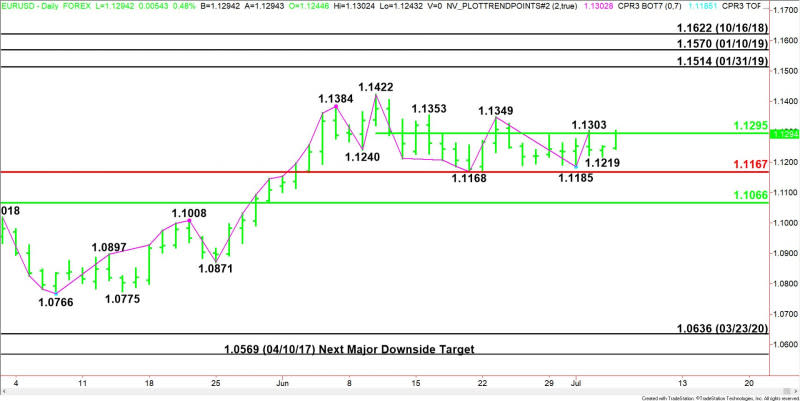
Daily Swing Chart Technical Analysis
The main trend is down according to the daily swing chart. A trade through 1.1349 will change the main trend to up. A move through 1.1185 will signal a resumption of the downtrend.
The minor trend is up. A trade through 1.1303 will reaffirm the minor trend. A move through 1.1219 will change the minor trend to down.
The short-term range is 1.1422 to 1.1168. Its 50% level or pivot at 1.1295 is controlling the near-term direction of the EUR/USD.
The main support is the Fibonacci level at 1.1167, followed by the 50% level at 1.1066.
Daily Swing Chart Technical Forecast
Based on the early price action and the current price at 1.1291, the direction of the EUR/USD the rest of the session on Monday is likely to be determined by trader reaction to the 50% level at 1.1295.
Bullish Scenario
A sustained move over 1.1295 will indicate the presence of buyers. Taking out 1.1303 will indicate the buying is getting stronger. This could trigger a surge into 1.1349.
Taking out 1.1349 will change the main trend to up. This could trigger an acceleration to the upside.
Bearish Scenario
A sustained move under 1.1295 will signal the presence of sellers. If this move creates enough downside momentum then look for a break into 1.1219.
A failure to hold 1.1219 could trigger a further break into the main bottom at 1.1185, followed by the support cluster at 1.1168 to 1.1167.
For a look at all of today’s economic events, check out our economic calendar.
This article was originally posted on FX Empire
More From FXEMPIRE:
AUD/USD Price Forecast – Australian Dollar Rallies to Kickoff Week
U.S. Stocks Set To Open Higher As Traders Bet On Swift Recovery
GBP/USD Price Forecast – British Pound Rallies Into the Same Area on Monday
E-mini S&P 500 Index (ES) Futures Technical Analysis – Traders Have Sights Set on 3220.50
The Bearish Combination of Soaring Silver and Lagging Miners
