
 Yahoo Finanza
 EUR/USD Mid-Session Technical Analysis for September 18, 2020
The Euro is trading lower against the U.S. Dollar on Friday after giving up earlier gains. The single-currency rallied shortly after the opening as Euro Zone bond yields edged higher. However, gains were limited as economic recovery concerns persisted. The common currency began its retreat when Euro Zones began to edge lower on expectations of more central bank measures.
At 12:56 GMT, the EUR/USD is trading 1.1842, down 0.0005 or -0.04%.
At the start of the session, Euro Zone government bond yields edged up after Thursday’s fall as stocks pared losses overnight signaling some risk-appetite, but persistent concerns about economic recovery as well as a lower-for-longer interest rate scenario underpinned prices.
Currently, Euro Zone government bond yields are edging down as expectations of more policy easing by central banks coupled with persistent concerns about economic recovery.
The price action suggests investors believe the European Central Bank (ECB) may need to introduce fresh stimulus measures to support an uneven and uncertain recovery in the Euro Zone and bring inflation closer to its 2% target, ECB policymaker Pablo Hernandez de Cos said on Friday.
Daily Swing Chart Technical Analysis
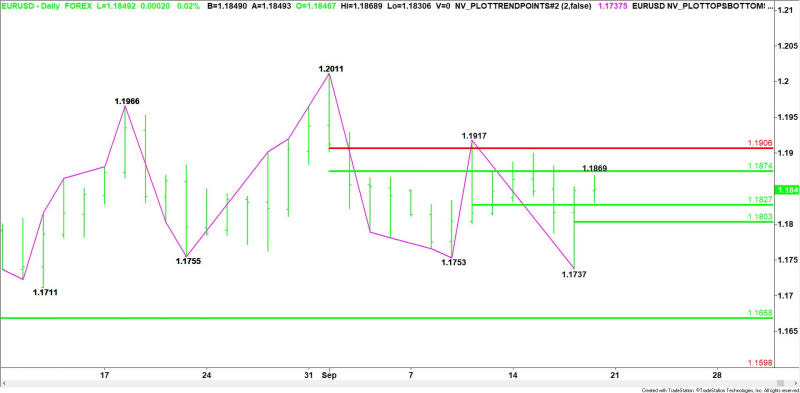
The main trend is down according to the daily swing chart. However, momentum is trending higher following the confirmation of yesterday’s closing price reversal bottom.
A trade through 1.1917 will change the main trend to up. A move through 1.1737 will signal a resumption of the downtrend.
The first minor range is 1.1737 to 1.1869. Its 50% level at 1.1803 is potential support.
The second minor range is 1.1917 to 1.1737. Its 50% level at 1.1827 is support. It’s holding so far today.
The short-term range is 1.2011 to 1.1737. Its retracement zone at 1.1874 to 1.1906 is resistance.
Daily Swing Chart Technical Forecast
The EUR/USD is currently trading inside a pair of 50% levels at 1.1827 to 1.1874. Holding inside this zone could lead to a rangebound trade.
Overcoming 1.1874 and sustaining the move will indicate the buying is getting stronger. This could lead to a test of 1.1906 to 1.1917.
A failure to hold 1.1827 will signal the presence of sellers. Taking out this level could extend the sell-off into 1.1803.
This article was originally posted on FX Empire
More From FXEMPIRE:
Natural Gas Weekly Price Forecast – Natural Gas Markets Break Down
Oil Gains Ground As Saudi Arabia Pushes For Full Compliance With OPEC+ Deal
Gold Weekly Price Forecast – Gold Markets Form Choppy Candlestick
U.S. Dollar Index (DX) Futures Technical Analysis – Failure at 92.680 Could Trigger Steep Break
