
 Yahoo Finanza
 Gap Fills Suggest Market Momentum May Stall
Technical Analysis teaches us that price Gaps tend to be filled by future price action. This is not something new for many of our readers, whom may be familiar with our mantra ‘Gaps always get filled!’. The big Gap created near February 24, 2020, the start of the COVID-19 market collapse, has recently been filled in the SPY and the TRAN (Transportation Index). We believe this “filling of the Gap” may be a sign that the upside market trend may begin to stall and potentially reverse.
Yesterday, we highlighted the potential for a continued upside bullish trend in the SPY pushing possibly 2% to 4% higher based on our Measured Move technique in our article entitled “President Trump Signs Additional Covid Relief – What to Expect From the Markets“. Today, with the TRAN gapping higher to fill the February 24, 2020, price Gap, we believe the upside move may be exhausting itself and nearing a period of congestion or reversal.
GAP FILLS MAY WARN OF TREND REVERSALS
Gaps are very interesting patterns where price momentum creates a “void” on the chart – essentially where price skips a price range because of momentum. Typically, these types of Gaps are often found in highly volatile periods of price action or strong momentum trends. Technical Analysis teaches us that most Gaps tend to be “filled” by future price action over time. This technical pattern should be viewed as a warning that the highest, most recent upside price Gap has currently been filled and would suggest that the markets are either going to continue to trend higher or reach an exhaustion point, stall and potentially reverse into a downside price trend.
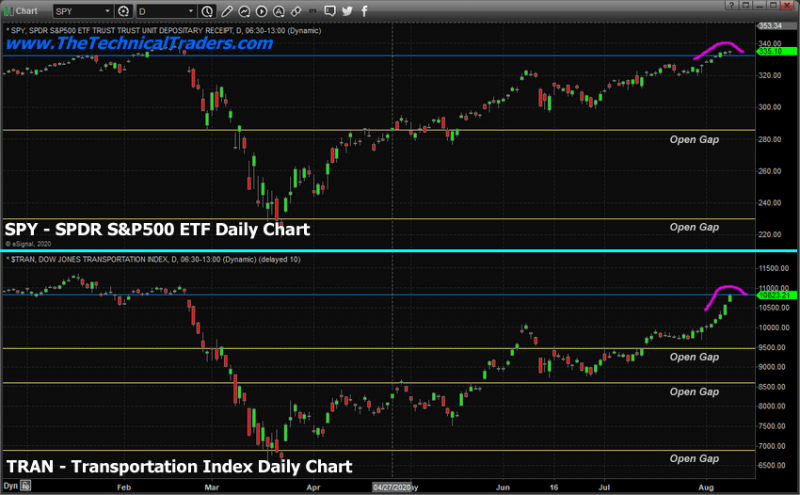
This SPY/TRAN chart above clearly highlights the upper Gap Fill that has recently taken place with the MAGENTA Arcing area on the charts. Both the SPY and the TRAN filled the Gap over a 4+ trading day range – with the TRAN Gapping higher on August 10 to properly fill the Gap. We’ve also highlighted “Lower Open Gaps” that are still unfilled. We wanted to point out that these lower gaps may become downside price targets if the trend changes into a Bearish Price Trend.
The Weekly Custom Smart Cash Index chart, below, highlights what our research team believes is an early indication that global markets are stalling in an “Island Top” type of pattern after a very clear upside price gap on July 20, 2020. This Custom Smart Cash Index also shows how weak the upside Smart Cash price trend has become after the July 20, 2020 upside gap even though the trends in the SPY/TRAN chart, above, appear to be accelerating upward quite quickly. We believe the difference between these trends relates to institutional investors moving away from risks near these elevated levels while retail traders are still pounding away trading the shorter-term trends.

One thing is certain, the Custom Smart Cash Index suggests price has been unable to rally above recent highs over the past 5+ weeks while the SPY and TRAN have moved dramatically higher – something seems disconnected right now. Our research team believes the move in Gold and Silver is clearly illustrating that institutional and traditional investors are moving away from the perceived risks near these ultra-high price levels – leaving many retail traders chasing the tail end of this rally.
We are still moderately confident that the SPY will continue to attempt to move above the $337.50 level before reaching a peak in price – yet we are also keenly aware that upside potential relates to only +0.68% from current levels. Once the $337.50 level is reached, we believe the SPY, and the US major indexes, are likely to stall and potentially reverse after completing another 100% Measured Price Move higher. Our suggestion would be to protect open long positions and prepare for the potential breakdown in price should the “Island Top” pattern complete. The downside potential is clearly evident by the number of Open Gaps that are present below current price levels. Each one of these becomes a potential downside price target.
If you found this informative, then sign up now to get a pre-market video every day before the opening bell that walks you through the charts and my proprietary technical analysis of all of the major assets classes. You will also receive my easy-to-follow ETF swing trades that always include an entry price, a stop, two exit targets, as well as a recommended position sizing. Visit my Active ETF Trading Newsletter to learn more.
For a look at all of today’s economic events, check out our economic calendar.
Chris Vermeulen
Chief Market Strategist
Founder of Technical Traders Ltd.
NOTICE : Our free research does not constitute a trade recommendation or solicitation for our readers to take any action regarding this research. It is provided for educational purposes only.
This article was originally posted on FX Empire
More From FXEMPIRE:
EOS, Ethereum and Ripple’s XRP – Daily Tech Analysis – August 11th, 2020
Gold Price Forecast – Gold Markets Gap Higher but Stay Relatively Quiet
Natural Gas Price Prediction – Prices Slide Following CFTC Report and Cooler Weather Forecast
US Stock Market Overview – Stock Close Mixed, The Dow Rises, the Nasdaq Drop
The $1.32 Resistance Rejects Sterling’s Uptrend Throughout the Week
