
 Yahoo Finanza
 Gold Price Futures (GC) Technical Analysis – Strengthens Over $1800.00, Weakens Under $1795.00
Gold futures are edging lower early Monday after giving back more than half of its gains the previous session on U.S. Federal Reserve chief Jerome Powell’s comments that inflation could ease next year and the central bank was on track to start tapering its stimulus.
At 02:58 GMT, December Comex gold futures are trading $1795.30, down $1.00 or -0.06%.
On Friday, gold futures rallied to their highest level since September 7 before trimming gains on Fed Chairman Jerome Powell’s comments on tapering. The price action suggests weak sellers were taken out on the move since there is little evidence of new buying.
Buyers are being cautious which means they aren’t likely to chase the market higher. During the current rally, they seem to be more inclined to buy dips.
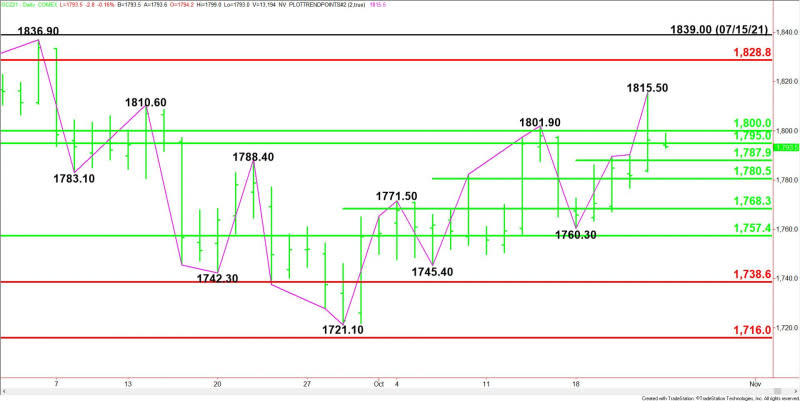
Daily Swing Chart Technical Analysis
The main trend is up according to the daily swing chart. A trade through $1815.50 will signal a resumption of the uptrend. A move through $1760.30 will change the main trend to down.
Gold is currently trading inside a pair of 50% levels at $1795.00 and $1800.00. This area is controlling the near-term direction of the market.
On the upside, resistance is a long-term 50% level at $1800.00 and a long-term Fibonacci level at $1828.80.
On the downside, the nearest support is a series of 50% levels at $1795.00, $1787.90 and $1780.50. These levels are followed by $1768.30 and $1747.40.
Daily Swing Chart Technical Forecast
The direction of the December Comex gold market early Monday is likely to be determined by trader reaction to $1795.00.
Bullish Scenario
A sustained move over $1795.00 will indicate the presence of buyers. The first upside target is $1800.00.
Taking out $1800.00 with strong volume could trigger an acceleration to the upside with $1815.50 the next potential target.
Bearish Scenario
A sustained move under $1795.00 will signal the presence of sellers. This could trigger a break into $1787.90. Buyers could come in on the first test of this level. If it fails then look for the selling to possibly extend into the next 50% level at $1780.50.
The 50% level at $1780.50 is a potential trigger point for an acceleration into another 50% level at $1768.30.
For a look at all of today’s economic events, check out our economic calendar.
This article was originally posted on FX Empire
