
 Yahoo Finanza
 Hang Seng Index and Natural Gas Overview
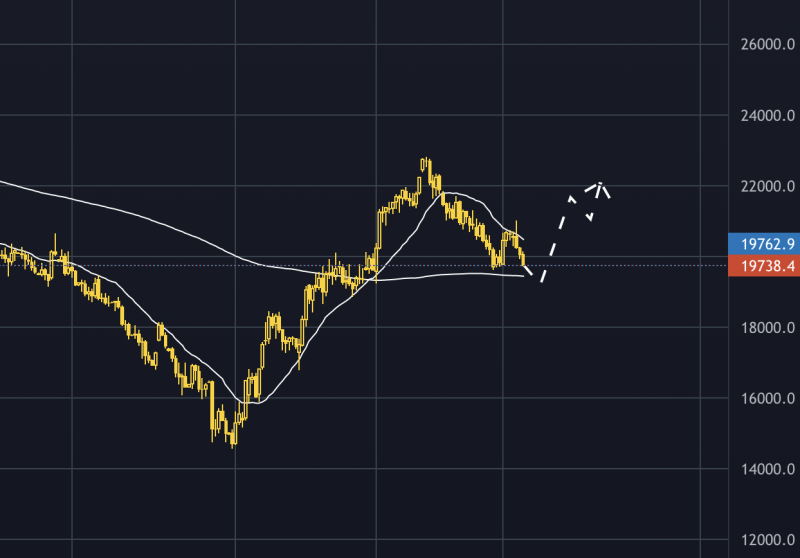
Hang Seng Index
With that, manufacturing PMI from China looks promising: it keeps above 50 for two months in a row. Many stocks from China have been heavily oversold last year, with p/e ratios dropping 30-40% from the peak in 2021, so they have the potential for a quicker rebound than their peers in the US, should the optimism get back to equity markets.
Technically, all stock indices are now either in a consolidation or correction mode. Though, for HK50, there’s a strong support level ahead, built with a 200-day moving average. Should the price test this level, it may rebound higher and resume the bullish upswing.
Natural Gas
Natural gas is traded in a form of futures on New York Mercantile Exchange, which is the part of CME Group. According to reports from CFTC, net long position of commercial traders for natural gas futures has reached the 2-year peak. That usually represents an intermediate-term bullish signal.
Warm winter’s temperatures had led to accumulation of substantial inventories on natural gas in Europe and the US: gas storage in Europe was around 60% with a seasonal average of 37%. Inventories for the US were almost 20% higher than their average for two years. This resulted in a massive drop of Natural gas prices.
Technically, there was a parabolic acceleration to the downside, with a potentially reversal formation at the bottom. The price area of 2.7 – 3 has become a resistance, but the price action seems to be robust to sell-offs amid correction for oil and gold. There’s a possibility for Natural gas to test the level of 3 again, which may open the road to 3.5 – 4 area.

If you want to learn more about what is moving the markets, join our monthly live analysis and trading session this coming Monday. Register here.
This article was originally posted on FX Empire
