
 Yahoo Finanza
 Market Wrap: Bitcoin Price Rises but Ether Outpaces as Merge Nears
Bitcoin’s (BTC) price rose 2% in Thursday morning trading and held those gains throughout the day. The largest cryptocurrency by market capitalization remains above $24,000.
Ether’s (ETH) price climbed 4%. ETH’s push higher occurred on higher than average trading volume when compared to its 20-day moving average.
This article originally appeared in Market Wrap, CoinDesk’s daily newsletter diving into what happened in today's crypto markets. Subscribe to get it in your inbox every day.
As highlighted in Thursday morning’s First Mover Americas, Ether prices rose following the third and final dress rehearsal on Ethereum’s Goerli testing blockchain ahead of the eagerly anticipated Merge. The test’s success brought the Ethereum blockchain one step closer to converting from proof-of-work to a more energy-efficient proof-of-stake protocol.
Many Ethereum observers expect the conversion to proof-of-stake to have a deflationary effect on the supply of ETH, thereby slowing the rate at which the supply of the asset increases. Historically, a reduction of supply for any asset pushes its overall value higher.
Additionally, the move to proof-of-stake will allow ETH holders to generate cash flows by “staking” their ETH and earning rewards.
Traditional markets were mixed, with the Dow Jones Industrial Average up 0.1% while the S&P 500 and Nasdaq composite declined 0.03% and 0.5%
In commodities, the price of crude oil was trading 2.2% higher while gold, a traditional safe haven asset during stressful economic times, declined by 0.6%.
●Bitcoin (BTC): $24,164 +1.9%
●Ether (ETH): $1,896 +3.9%
●S&P 500 daily close: 4,207.27 −0.1%
●Gold: $1,804 per troy ounce +0.4%
●Ten-year Treasury yield daily close: 2.89% +0.1
Bitcoin, ether and gold prices are taken at approximately 4pm New York time. Bitcoin is the CoinDesk Bitcoin Price Index (XBX); Ether is the CoinDesk Ether Price Index (ETX); Gold is the COMEX spot price. Information about CoinDesk Indices can be found at coindesk.com/indices.
Throughout BTC’s Recent Rise, ETH Has Been the Stronger Performer
Instead of looking at the bitcoin price movement in U.S. dollar terms, today’s chart considers ether prices relative to BTC.
Notably, ETH prices in BTC terms have increased 41% since July 13. The move higher has come on average volume, while the Relative Strength Index (RSI is a proxy for momentum) has increased from 45.89 to its current 70.57. An RSI level of 50 is considered neutral, whereas a level in excess of 70 traditionally implies that the asset is “overbought.” An overbought reading implies that the magnitude of change in an asset has taken it past its fair market value, thereby making it a candidate to be sold.
Moreover, the 50-period exponential moving average (EMA) for the ETH/BTC pair crossed its 200-period EMA, completing a “golden cross.”
In technical terms, a golden cross occurs when the shorter term 50-day EMA crosses the longer-term 200 EMA, and is viewed as a precursor to a bull market. In this case, the signal implies that ETH is poised to outperform BTC.
The upcoming Ethereum Merge bears mention with this chart pattern because investors may be moving into ETH in anticipation of its completion. The question remains whether the move higher is a long-term development to a structural change or a short-term reaction to an upcoming event. If it is the latter, investors may be inclined to take profits in September, when the Merge is scheduled to occur.
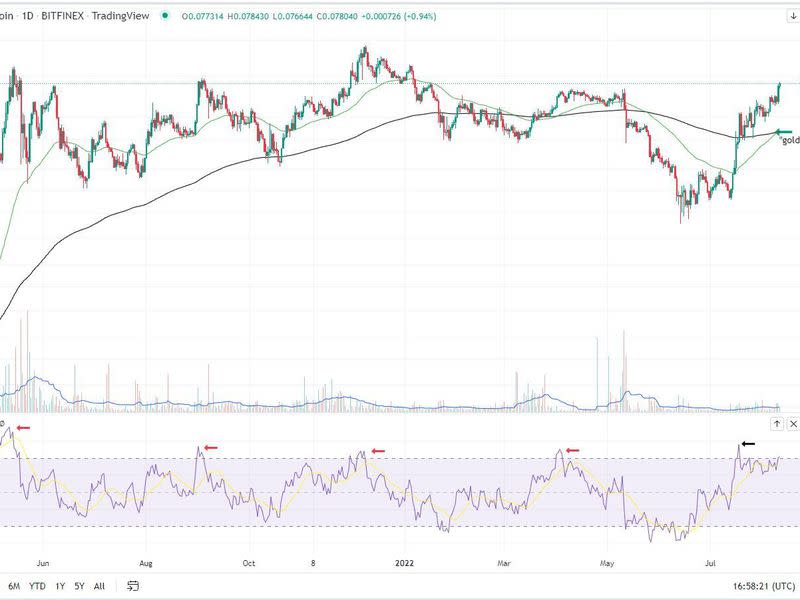
Investors should consider past RSI levels above 70 and subsequent price behavior shortly after. The above chart highlights four past instances since May 2021 of the RSI reaching overbought levels.
The performance of ETH relative to BTC 30 days after each occurrence was -13%, -5%, -16%, and -3%, respectively. Since the most recent overbought reading (July 18), ETH prices are 11% higher, which appears to be an anomaly from past performance.
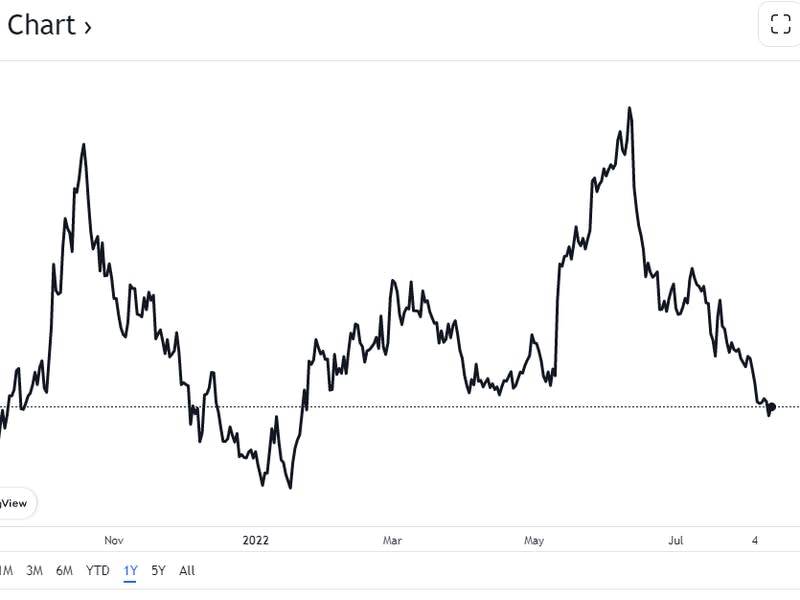
Not surprisingly, BTC’s market cap dominance has declined recently
While still the largest cryptocurrency by market capitalization, in recent weeks bitcoin has lost some of its dominance to ETH as the Merge date nears.
The “bitcoin dominance” chart highlights the decline.
Altcoin roundup
Energy Web Token Jumps 25%: The energy web token (EWT) jumped to a high of $3.18 Thursday after it was mentioned in a BlackRock (BLK) press release. The nonprofit that issues the coin received praise from the world’s largest asset manager for trying to reduce bitcoin mining emissions. Read more here.
Polkadot Now Has a Decentralized Version of 'Wrapped' Bitcoin: Interlay, a decentralized stablecoin network, has launched interBTC (iBTC) – a wrapped bitcoin token. One iBTC can be redeemed directly on the Bitcoin blockchain for one BTC. Read more here.
Ethereum’s Merge Now Has Tentative September Dates: A document circulated among Ethereum developers that showed there could be several scenarios for when the Merge on the Ethereum mainnet might occur. Likely dates include Sept. 15, Sept. 16 or Sept. 20. Read more here.
Relevant insight
Listen 🎧: Today’s "CoinDesk Markets Daily" podcast discusses the latest market movements and Ethereum’s successful final testnet ahead of the Merge.
Bitcoin Rallies to 2-Month High, What Next?: The Federal Reserve's plan to accelerate quantitative tightening starting in September may bring volatility to markets.
The Top ‘Ethereum Killers’ Compared: So-called “Ethereum killers” are building momentum, including a growing share of the NFT market. Here’s a closer look at four of the top competitors.
‘Hey, Look, It’s a Monkey!’ Ethereum’s Vitalik Buterin Pokes Fun at Ape NFTs, Expresses Optimism About the Merge: The co-founder spoke as ETH, the network’s native token, reached the highest levels since June as the Merge passed its final test.
Maple Finance, a DeFi Platform for Institutional Lending, Unveils $40M Liquidity Pool: The pool is backed by crypto-native investment firm Maven 11.
BlackRock, Fresh off Coinbase Tie-Up, Offers Direct Bitcoin Exposure: The institutional investor-focused spot bitcoin private trust will track the price of the cryptocurrency.
Ban Banks From Holding Crypto, UN Development Body Says: UNCTAD recommends extra taxes on transactions and ad restrictions to boost states' revenue and safeguard financial stability in developing countries.
Binance Among Crypto Exchanges Blocked as Uzbekistan Clamps Down: FTX and Huobi are also inaccessible as the authorities restrict access to unlicensed centralized trading platforms.
Email Marketing Firm Mailchimp Suspends Several Crypto-Related Accounts: The stoppage appears to have started several weeks ago.
US Regulators Consider Asking Large Hedge Funds to Disclose Crypto Exposure: The proposal involves adding a question about digital assets to reporting requirements that also cover private credit and equity and real estate.
South Korea Arrests 3 in Multibillion-Dollar Crypto-Linked Probe, a Local Media Outlet Reports: Authorities are investigating $3.4 billion in "abnormal transactions" involving foreign exchange and crypto investments, according to a local media outlet.
Other markets
Biggest Gainers
Asset | Ticker | Returns | DACS Sector |
|---|---|---|---|
Ethereum | +3.9% | ||
Solana | +3.9% | ||
Loopring | +2.0% |
Biggest Losers
Asset | Ticker | Returns | DACS Sector |
|---|---|---|---|
Polkadot | −2.9% | ||
Gala | −0.9% | ||
Terra | −0.8% |
Sector classifications are provided via the Digital Asset Classification Standard (DACS), developed by CoinDesk Indices to provide a reliable, comprehensive and standardized classification system for digital assets. The CoinDesk 20 is a ranking of the largest digital assets by volume on trusted exchanges.
