
 Yahoo Finanza
 NZD/USD Forex Technical Analysis – Traders Will Be Monitoring Fed for Future Rate Hike Clues
The New Zealand Dollar is inching higher against the U.S. Dollar on Wednesday after hitting a two-year low the previous session. Expectations for higher interest rates from the U.S. Federal Reserve have been driving down global equity markets as well as higher-yielding currencies like the Kiwi.
At 05:43 GMT, the NZD/USD is trading .6227, up 0.0009 or +0.14%.
Big Fed Rate Hike Expected
The Federal Reserve is widely expected to announce an outsized 75 basis point interest rate hike at the conclusion of its two-day meeting at 18:00 GMT. The move will be the Fed’s powerful attempt to try to rein in rampant inflation.
Market pricing indicates a 99.7% chance of a 75 basis point rate hike at the Fed’s meeting, according to the CME’s Fedwatch tool, up from only 3.9% a week ago. The jump in the odds of a rate hike was fueled by Friday’s U.S. consumer price index (CPI) surge.
With the June rate hike widely expected, the focus is likely to be on what the Fed intends to due with rates in July and September.
New Zealand Q1 Current Account Deficit NZ$8.5 Billion
New Zealand posted a seasonally adjusted current account deficit of NZ$8.5 billion in the first quarter of 2022, Statistics said on Wednesday – following the NZ$6.6 billion shortfall in the three months prior.
Daily Swing Chart Technical Analysis
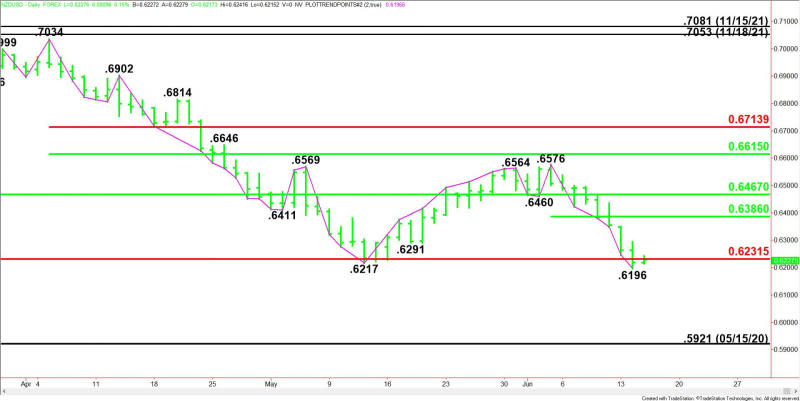
The main trend is down according to the daily swing chart. A trade through .6196 will signal a resumption of the downtrend.
A move through .6576 will change the main trend to up. This is highly unlikely by due to the prolonged move down in terms of price and time, the NZD/USD begins today’s session inside the window of time for a potentially bullish closing price reversal bottom. This chart pattern won’t change the trend, but it could trigger the start of a short-term counter-trend rally.
The NZD/USD is currently straddling a long-term Fibonacci level at .6231. The nearest resistance is a minor pivot at .6386, followed by a long-term 50% level at .6467.
Daily Swing Chart Technical Forecast
Trader reaction to the long-term Fibonacci level at .6231 is likely to determine the direction of the NZD/USD early Wednesday.
Bearish Scenario
A sustained move under .6231 will indicate the presence of sellers. Taking out .6196 will indicate the selling pressure is getting stronger. This could trigger the start of an acceleration to the downside with the May 15, 2020 main bottom at .5921 the next major target.
Bullish Scenario
A sustained move over .6232 will signal the presence of buyers. If this creates enough upside momentum then look for a possible short-covering rally into the pivot at .6386.
For a look at all of today’s economic events, check out our economic calendar.
This article was originally posted on FX Empire
