
 Yahoo Finanza
 Stock Market Bottom Or Bull Trap? The Wyckoff Method Reveals Insights
Last week S&P 500, Dow Jones, Nasdaq and Russell 2000 all broke below the major support and dropped sharply into an oversold condition. This sharp move was anticipated just right before it happened based on the bear market leading indicator as I discussed in the video at the bottom of the post.
Using Stock Market Breadth As Market Timing
On Friday all the 4 indices had a strong rebound off the oversold condition. This is significant not because of the magnitude of the rally, but the market breadth because the difference between the number of stocks hit 52 Weeks High and 52 Weeks Low spiked from -1600 to -160. This is a sharp turn from a very bearish market breadth to almost neutral as majority of the stocks participated the reversal. Refer to the market breadth chart below:

From the chart above, the spike of the market breadth after 24 January 2022 and 24 February 2022 (circled in orange) corresponded to a swing low in S&P 500. A market rally can be expected based on the current market breadth. Next, we need to determine the quality of the potential rally to anticipate how far it can go.
Wyckoff Method To Identify Bear Market Bottom
Let’s apply the Wyckoff method to find out if this is likely a stock market bottom or a bull trap by focusing on the price action and the volume. Refer to the chart of S&P 500 Futures below:
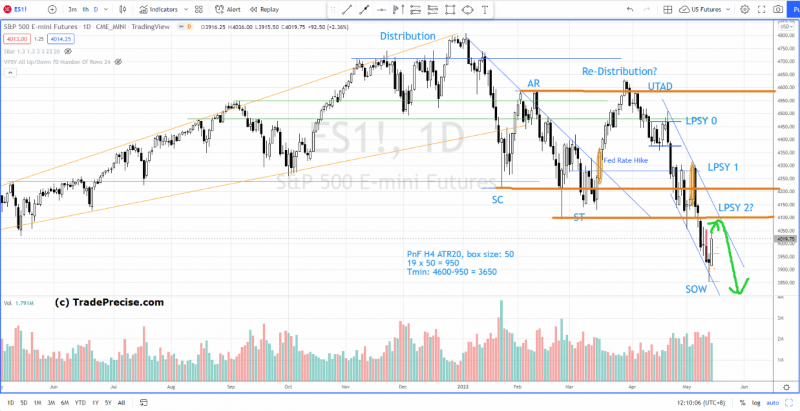
The bearish bias of S&P 500 was formed after the selloff happened in January 2022. Subsequently, a Wyckoff re-distribution pattern was formed (as highlighted in orange). After the upthrust after distribution (annotated as UTAD), the rallies were of poor quality and the down swings were impulsive and volatile with increasing of supply. These are the key characteristics of a bear market leading to a sign of weakness (annotated as SOW).
The confirmation of the strong down swing was identified after the weak rally on 18 April 2022 (annotated as LPSY 0) where I explained in detail about the bearish signal detected from the Wyckoff distribution pattern in the video.
Last week S&P 500 broke below the major support at 4100 followed by a sharp move down below 3900 within 4 days, which marked a sign of weakness from the re-distribution structure. Despite the sharp move down, climatic price action and volume did not show up, suggested pending institution capitulation. This is a key difference when comparing to the selling climax low formed on 24 January 2022.
There was presence of demand on last Thursday as reflected on the demand tail and the slight increase of volume while the price hit the oversold of the down channel. This was confirmed by Friday’s price action. This is likely the relief rally to test the axis line near 4050-4100 where the support-turned-resistance.
The resistance zone coincides with the supply line of the down channel, which could potentially form the last point of supply (annotated as LPSY 2) where the supply will be attracted for institutions to sell into strength (as annotated in green arrow) followed by lower price target at 3600 (and lower). This could be similar to the bear market in 2008 from the price structure to the market rotation sequence as discussed in the video 2 weeks ago.
The Leading Indicator In Bear Market
As mentioned earlier, watch the video below find out how to use this leading indicator in the bear market as early warning before the sharp move happened last week (and beyond) in S&P 500.
Based on the characteristics of the price action and volume, selling into strength to avoid bull trap is a better bet. Under a more bullish scenario where the current rally is strong enough to test 4200, a trading range could be anticipated rather than a continuation of the selloff to test 3600 in the short-term. Visit TradePrecise.com to get more stock market insights in email for free.
This article was originally posted on FX Empire
