
 Yahoo Finanza
 Valuations Aren’t Stretched, One Indicator Says Buy
Stocks can press higher.
Many of the largest names in the S&P 500 (SPY) like Apple (AAPL), Amazon (AMZN), and NVIDIA (NVDA) are some of the highest quality companies globally. It’s not surprising they trade at a premium and thus a higher valuation. But the rest of the market is less expensive.
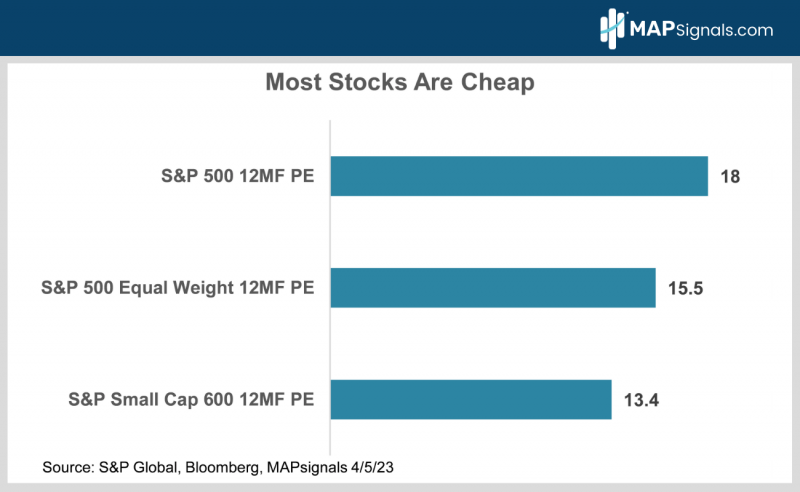
The larger companies elevate the overall index valuation. However, if you neutralize the top 15 mega-cap companies by looking at the S&P 500 equal weight index (RSP) instead of the market cap weighted S&P, the 12-month forward P/E ratio shrinks to 15.5X from 18X.
Small caps are more attractive with the S&P SC 600 Index (IJR) trading at only 13.5X. Note the S&P small cap index excludes unprofitable companies. 35% of Russell 2000 (IWM) constituents lose money so that index’s valuations is a lot higher.
Check out the following chart:
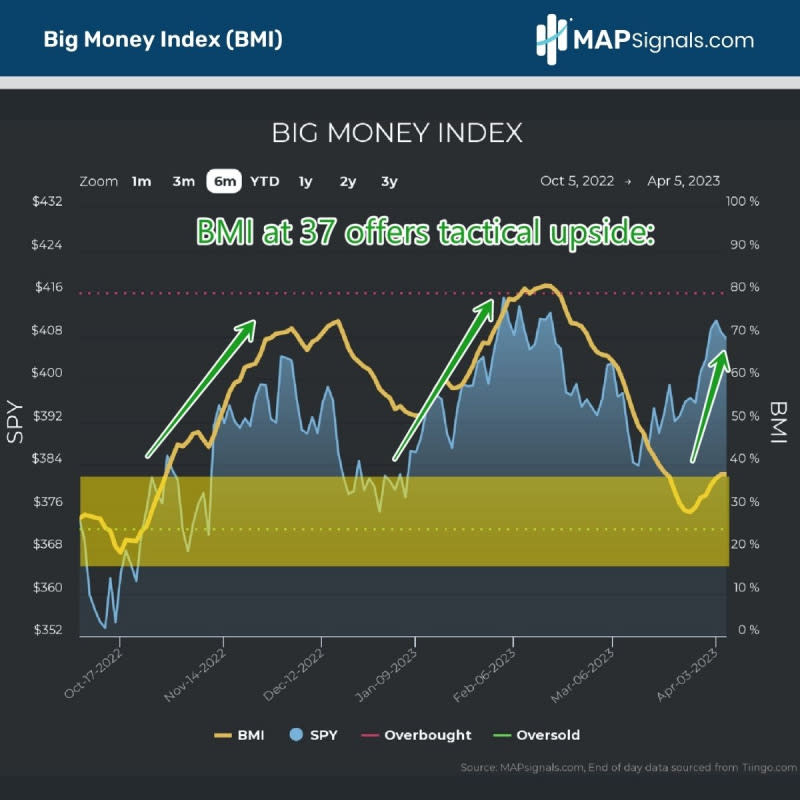
The Big Money Index Says Buy
There are plenty of contrarian indicators out there. The Big Money Index (BMI) is one of the best I’ve seen. It tracks the flows of big money buying and selling in stocks.
It’s great for spotting trends in the market.
When it rises north of 80, it signals an overbought market due for a pullback. When the BMI falls below a 30 reading, stocks can snapback quickly. Historically, an oversold BMI is a great time to shop for stocks on sale.
When the BMI hit 82 in early February, we told you to take some chips off the table. On March 24, it hit 29 as the S&P 500 clocked an intra-day low near 3900. Markets have since jumped and the BMI has rebounded to 37 as institutional selling has waned.
Currently, the BMI is positioned for tactical upside, rather than risk:
The Bottom Line
Disclosure: the author holds no position in SPY, AAPL, AMZN, NVDA, RSP, IWM, or IJR at the time of publication.
Learn more about the MAPsignals process here.
This article was originally posted on FX Empire
