
 Yahoo Finanza
 Returns On Capital Signal Tricky Times Ahead For Mi Technovation Berhad (KLSE:MI)
There are a few key trends to look for if we want to identify the next multi-bagger. Ideally, a business will show two trends; firstly a growing return on capital employed (ROCE) and secondly, an increasing amount of capital employed. Basically this means that a company has profitable initiatives that it can continue to reinvest in, which is a trait of a compounding machine. However, after investigating Mi Technovation Berhad (KLSE:MI), we don't think it's current trends fit the mold of a multi-bagger.
Return On Capital Employed (ROCE): What Is It?
For those who don't know, ROCE is a measure of a company's yearly pre-tax profit (its return), relative to the capital employed in the business. Analysts use this formula to calculate it for Mi Technovation Berhad:
Return on Capital Employed = Earnings Before Interest and Tax (EBIT) ÷ (Total Assets - Current Liabilities)
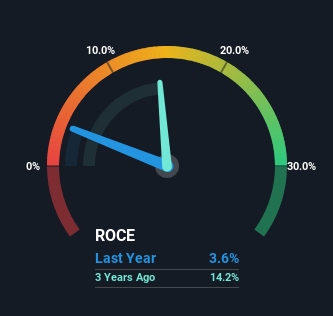
0.036 = RM40m ÷ (RM1.2b - RM98m) (Based on the trailing twelve months to December 2023).
Thus, Mi Technovation Berhad has an ROCE of 3.6%. In absolute terms, that's a low return and it also under-performs the Semiconductor industry average of 6.2%.
View our latest analysis for Mi Technovation Berhad
Above you can see how the current ROCE for Mi Technovation Berhad compares to its prior returns on capital, but there's only so much you can tell from the past. If you're interested, you can view the analysts predictions in our free analyst report for Mi Technovation Berhad .
How Are Returns Trending?
On the surface, the trend of ROCE at Mi Technovation Berhad doesn't inspire confidence. Around five years ago the returns on capital were 13%, but since then they've fallen to 3.6%. However it looks like Mi Technovation Berhad might be reinvesting for long term growth because while capital employed has increased, the company's sales haven't changed much in the last 12 months. It's worth keeping an eye on the company's earnings from here on to see if these investments do end up contributing to the bottom line.
The Bottom Line
In summary, Mi Technovation Berhad is reinvesting funds back into the business for growth but unfortunately it looks like sales haven't increased much just yet. Unsurprisingly, the stock has only gained 35% over the last five years, which potentially indicates that investors are accounting for this going forward. As a result, if you're hunting for a multi-bagger, we think you'd have more luck elsewhere.
One more thing, we've spotted 1 warning sign facing Mi Technovation Berhad that you might find interesting.
While Mi Technovation Berhad isn't earning the highest return, check out this free list of companies that are earning high returns on equity with solid balance sheets.
Have feedback on this article? Concerned about the content? Get in touch with us directly. Alternatively, email editorial-team (at) simplywallst.com.
This article by Simply Wall St is general in nature. We provide commentary based on historical data and analyst forecasts only using an unbiased methodology and our articles are not intended to be financial advice. It does not constitute a recommendation to buy or sell any stock, and does not take account of your objectives, or your financial situation. We aim to bring you long-term focused analysis driven by fundamental data. Note that our analysis may not factor in the latest price-sensitive company announcements or qualitative material. Simply Wall St has no position in any stocks mentioned.
