
 Yahoo Finanza
 E-mini S&P 500 Index (ES) Futures Technical Analysis – Benchmark Index Supported by Microsoft Surge
September E-mini S&P 500 Index futures are trading higher at the mid-session on Monday. The strength is being driven by Microsoft’s pursuit of TikTok’s U.S. operations and a clutch of upbeat quarterly earnings reports. Gains are likely being limited by Congress’ inability to agree on a fiscal coronavirus stimulus deal.
At 16:04 GMT, September E-mini S&P 500 Index futures are trading 3288.50, up 25.00 or +0.83%.
Microsoft jumped 3.7% as it said it would push ahead with talks to acquire the U.S. operations of Chinese-owned TikTok after President Donald Trump reversed course on a planned ban of the short-video app. Additionally, tech and healthcare led gains among the 11 S&P 500 sectors.
A rally in tech-related stocks and historic stimulus have lifted the S&P 500 to within 4% of its peak, but faltering macroeconomic data and a gridlock on more government stimulus have made investors cautious again.
Daily Swing Chart Technical Analysis
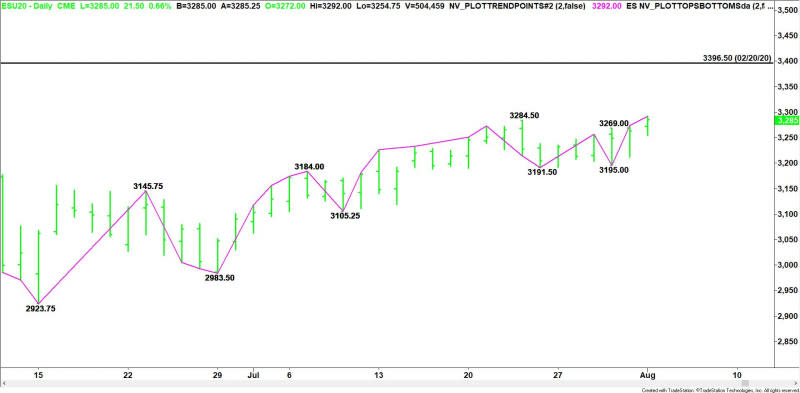
The main trend is up according to the daily swing chart. The uptrend was reaffirmed earlier in the session when buyers took out the last main top at 3284.50. A trade through 3195.00 will change the main trend to down.
After trading inside a compressed range for two weeks, the index appears ready to break out to the upside. Today’s early price action suggests there is a bid, but we’d like to see if buyers will come in on a pullback into the former main tops at 3284.50 and 3269.00.
Defending 3284.and 3269 will indicate that buyers are coming in with conviction and defending the breakout. This will also indicate that the buying was being fueled by new money coming into the market rather than buy stops.
For a look at all of today’s economic events, check out our economic calendar.
This article was originally posted on FX Empire
