
 Yahoo Finanza
 Here's What's Concerning About Bahvest Resources Berhad's (KLSE:BAHVEST) Returns On Capital
When it comes to investing, there are some useful financial metrics that can warn us when a business is potentially in trouble. Typically, we'll see the trend of both return on capital employed (ROCE) declining and this usually coincides with a decreasing amount of capital employed. Trends like this ultimately mean the business is reducing its investments and also earning less on what it has invested. And from a first read, things don't look too good at Bahvest Resources Berhad (KLSE:BAHVEST), so let's see why.
Return On Capital Employed (ROCE): What Is It?
For those who don't know, ROCE is a measure of a company's yearly pre-tax profit (its return), relative to the capital employed in the business. To calculate this metric for Bahvest Resources Berhad, this is the formula:
Return on Capital Employed = Earnings Before Interest and Tax (EBIT) ÷ (Total Assets - Current Liabilities)
0.027 = RM3.8m ÷ (RM172m - RM34m) (Based on the trailing twelve months to September 2023).
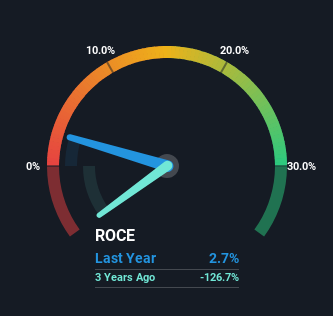
So, Bahvest Resources Berhad has an ROCE of 2.7%. In absolute terms, that's a low return and it also under-performs the Metals and Mining industry average of 6.0%.
See our latest analysis for Bahvest Resources Berhad
While the past is not representative of the future, it can be helpful to know how a company has performed historically, which is why we have this chart above. If you're interested in investigating Bahvest Resources Berhad's past further, check out this free graph covering Bahvest Resources Berhad's past earnings, revenue and cash flow.
What The Trend Of ROCE Can Tell Us
In terms of Bahvest Resources Berhad's historical ROCE trend, it isn't fantastic. To be more specific, today's ROCE was 24% five years ago but has since fallen to 2.7%. On top of that, the business is utilizing 59% less capital within its operations. When you see both ROCE and capital employed diminishing, it can often be a sign of a mature and shrinking business that might be in structural decline. If these underlying trends continue, we wouldn't be too optimistic going forward.
On a side note, Bahvest Resources Berhad's current liabilities have increased over the last five years to 20% of total assets, effectively distorting the ROCE to some degree. Without this increase, it's likely that ROCE would be even lower than 2.7%. Keep an eye on this ratio, because the business could encounter some new risks if this metric gets too high.
The Bottom Line On Bahvest Resources Berhad's ROCE
In short, lower returns and decreasing amounts capital employed in the business doesn't fill us with confidence. And, the stock has remained flat over the last five years, so investors don't seem too impressed either. Unless there is a shift to a more positive trajectory in these metrics, we would look elsewhere.
One more thing to note, we've identified 2 warning signs with Bahvest Resources Berhad and understanding them should be part of your investment process.
While Bahvest Resources Berhad isn't earning the highest return, check out this free list of companies that are earning high returns on equity with solid balance sheets.
Have feedback on this article? Concerned about the content? Get in touch with us directly. Alternatively, email editorial-team (at) simplywallst.com.
This article by Simply Wall St is general in nature. We provide commentary based on historical data and analyst forecasts only using an unbiased methodology and our articles are not intended to be financial advice. It does not constitute a recommendation to buy or sell any stock, and does not take account of your objectives, or your financial situation. We aim to bring you long-term focused analysis driven by fundamental data. Note that our analysis may not factor in the latest price-sensitive company announcements or qualitative material. Simply Wall St has no position in any stocks mentioned.
Have feedback on this article? Concerned about the content? Get in touch with us directly. Alternatively, email editorial-team@simplywallst.com
