
 Yahoo Finanza
 E-mini NASDAQ-100 Index (NQ) Futures Technical Analysis – Strongest of the Three Major Indexes
June E-mini NASDAQ-100 Index futures are trading higher on Wednesday, helped by a jump in shares of Netflix, which reported earnings after the previous session’s close. A stable crude oil market after two days of steep selling pressure is also contributing to the early session strength.
The streaming company, Netflix, posted an increase of 15.8 million paid subscribers in its first quarter earnings Tuesday, far higher than expected. It headed into that report with its stock up a massive 36% so far this year, bucking the broader sell-off.
At 08:37 GMT, June E-mini NASDAQ-100 Index futures are trading 8539.75, up 108.00 or +1.28%.
Daily Swing Chart Technical Analysis
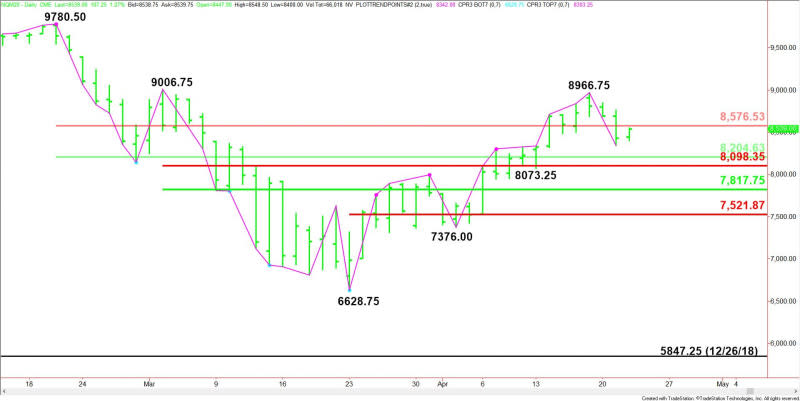
The main trend is up according to the daily swing chart. A trade through 8966.75 will change the main trend to up. The main trend will change to down on a move through the last main bottom at 7376.00.
The minor trend is also up. A trade through 8073.25 will change the minor trend to down. This will also shift momentum to the downside.
The main range is 9780.50 to 6628.75. The index is currently testing its retracement zone at 8204.50 to 8576.50. This zone is controlling the longer-term direction of the index.
The intermediate range is 9006.75 to 6628.75. Its retracement zone at 8098.25 to 7817.75 is support.
The short-term range is 6628.75 to 8966.75. Its retracement zone at 7797.75 to 7521.75 is another support zone.
The major support is the price cluster at 8204.50 to 8098.25.
Daily Swing Chart Technical Forecast
Based on the early price action and the current price at 8539.75, the direction of the June E-mini NASDAQ-100 Index the rest of the session on Wednesday is likely to be determined by trader reaction to the main Fibonacci level at 8576.50.
Bullish Scenario
A sustained move over 8576.75 will indicate the presence of buyers. Overtaking the minor pivot at 8683.50 will indicate the buying is getting stronger. Taking out this level could trigger a further rally into the main top at 8966.75.
Bearish Scenario
A sustained move under 8576.75 will signal the presence of sellers. If this creates enough downside momentum then look for a break into the support cluster at 8204.50 to 8098.25. This area has to hold or the index could collapse.
This article was originally posted on FX Empire
