
 Yahoo Finanza
 Investors in Avid Technology (NASDAQ:AVID) have seen incredible returns of 406% over the past five years
While Avid Technology, Inc. (NASDAQ:AVID) shareholders are probably generally happy, the stock hasn't had particularly good run recently, with the share price falling 19% in the last quarter. But that doesn't change the fact that the returns over the last half decade have been spectacular. In that time, the share price has soared some 406% higher! Arguably, the recent fall is to be expected after such a strong rise. But the real question is whether the business fundamentals can improve over the long term.
So let's investigate and see if the longer term performance of the company has been in line with the underlying business' progress.
Check out our latest analysis for Avid Technology
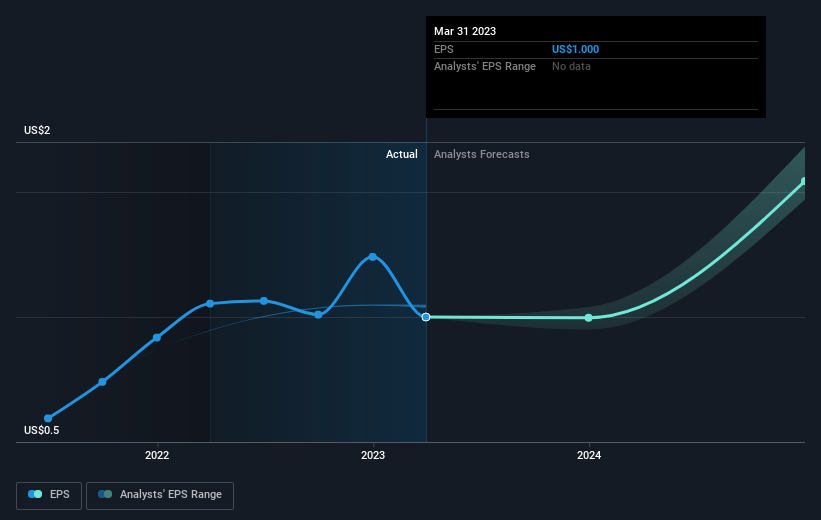
While markets are a powerful pricing mechanism, share prices reflect investor sentiment, not just underlying business performance. One imperfect but simple way to consider how the market perception of a company has shifted is to compare the change in the earnings per share (EPS) with the share price movement.
During the last half decade, Avid Technology became profitable. That kind of transition can be an inflection point that justifies a strong share price gain, just as we have seen here. Since the company was unprofitable five years ago, but not three years ago, it's worth taking a look at the returns in the last three years, too. We can see that the Avid Technology share price is up 188% in the last three years. In the same period, EPS is up 181% per year. This EPS growth is higher than the 42% average annual increase in the share price over the same three years. Therefore, it seems the market has moderated its expectations for growth, somewhat.
You can see below how EPS has changed over time (discover the exact values by clicking on the image).
We know that Avid Technology has improved its bottom line over the last three years, but what does the future have in store? It might be well worthwhile taking a look at our free report on how its financial position has changed over time.
A Different Perspective
Avid Technology shareholders are down 16% for the year, but the market itself is up 3.5%. Even the share prices of good stocks drop sometimes, but we want to see improvements in the fundamental metrics of a business, before getting too interested. On the bright side, long term shareholders have made money, with a gain of 38% per year over half a decade. It could be that the recent sell-off is an opportunity, so it may be worth checking the fundamental data for signs of a long term growth trend. While it is well worth considering the different impacts that market conditions can have on the share price, there are other factors that are even more important. Take risks, for example - Avid Technology has 2 warning signs (and 1 which can't be ignored) we think you should know about.
But note: Avid Technology may not be the best stock to buy. So take a peek at this free list of interesting companies with past earnings growth (and further growth forecast).
Please note, the market returns quoted in this article reflect the market weighted average returns of stocks that currently trade on American exchanges.
Have feedback on this article? Concerned about the content? Get in touch with us directly. Alternatively, email editorial-team (at) simplywallst.com.
This article by Simply Wall St is general in nature. We provide commentary based on historical data and analyst forecasts only using an unbiased methodology and our articles are not intended to be financial advice. It does not constitute a recommendation to buy or sell any stock, and does not take account of your objectives, or your financial situation. We aim to bring you long-term focused analysis driven by fundamental data. Note that our analysis may not factor in the latest price-sensitive company announcements or qualitative material. Simply Wall St has no position in any stocks mentioned.
Join A Paid User Research Session
You’ll receive a US$30 Amazon Gift card for 1 hour of your time while helping us build better investing tools for the individual investors like yourself. Sign up here
