
 Yahoo Finanza
 E-mini NASDAQ-100 Index (NQ) Futures Technical Analysis – Rate-Sensitive Microsoft, Amazon Fall as Yields Rise
June E-mini NASDAQ-100 Index futures are edging lower late in the session on Wednesday after giving up earlier gains. The catalysts behind the weakness are a decline in Amazon.com shares and lower chipmakers after a bearish brokerage report on Intel. Additionally, broad weakness is being fueled by higher crude oil prices which deepened worries about global inflation.
At 19:43 GMT, June E-mini NASDAQ-100 Index futures are at 12641.50, down 70.00 or -0.55%. The Invesco QQQ Trust ETF (QQQ) is at $308.06, down $1.81 or -0.58%.
Intel Leads Chipmakers Lower
Intel Corp slid 5% as Citi Research warned the chipmaker could pre-announce weaker-than-expected earnings for the second quarter. The Philadelphia Semiconductor SE Index lost 2.5%.
Inflation Fears Weigh on Rate-Sensitive Growth Stocks
Shares of Microsoft Corp and Amazon.com dipped 0.5% and 1.3%, respectively, as rate-sensitive growth stock took a hit from elevated Treasury yields. Benchmark 10-year Treasury Yields rose as traders took precautions ahead of Friday’ U.S. Consumer Price Inflation (CPI) report.
Daily Swing Chart Technical Analysis
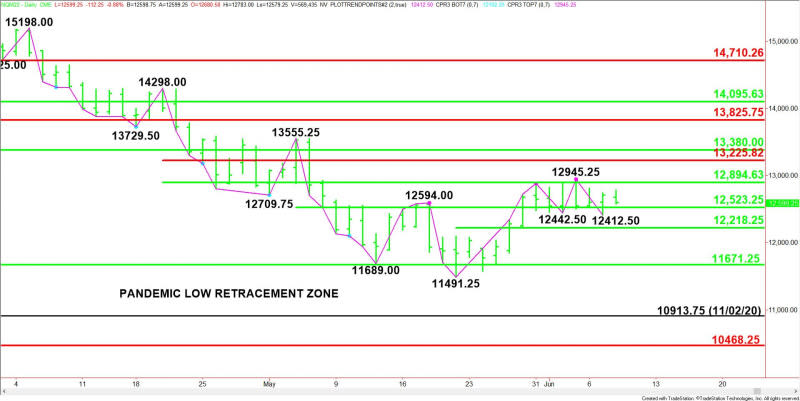
The main trend is down according to the daily swing chart. A trade through 12412.50 will signal a resumption of the downtrend. A move through 12945.25 will change the main trend to up.
On the downside, minor support is a pair of 50% levels at 12523.25 and 12218.25. The latter is a potential trigger point for an acceleration to the downside with the major support a long-term 50% level at 11671.25.
On the upside, resistance is a retracement zone at 12894.75 to 13226.00.
Daily Swing Chart Technical Forecast
Trader reaction to 12523.25 is likely to determine the direction of the June E-mini NASDAQ-100 Index into the close on Wednesday or on Thursday pre-market opening.
Bullish Scenario
A sustained move over 12523.25 will indicate the presence of buyers. This could trigger a late session rally into 12894.75 and 12945.25.
Bearish Scenario
A sustained move under 12523.25 will signal the presence of sellers. The first target is a minor bottom at 12412.50. Taking out this level could lead to a quick break into 12218.25.
The 50% level at 12218.25 is the trigger point for an acceleration to the downside.
For a look at all of today’s economic events, check out our economic calendar.
This article was originally posted on FX Empire
More From FXEMPIRE:
Microsoft says it will not enforce non-compete clauses in U.S. employee agreements
More than 600 conservatives, mostly in Texas, call for gun reform
UK’s John Lewis identifies rental home locations in diversification push
Gymnastics-Nassar whistleblower says lawsuits against FBI can prompt change for future survivors
Exclusive-Indonesian navy officers ask for $375,000 to release tanker – sources
