
 Yahoo Finanza
 Gold Price Futures (GC) Technical Analysis – Tight Trading Ranger Indicates Impending Volatility
Gold futures are trading marginally higher on low volume on Friday, buoyed by a weaker U.S. Dollar and lingering concerns over the speed and shape of the U.S. economic recovery. The key issues driving the trade on Friday’s are worries over the COVID-19 pandemic’s impact on the U.S. economy and a weakening labor market.
Low interest rates continue to provide support, while pressuring the U.S. Dollar. This is helping to drive foreign demand for dollar-denominated gold.
At 18:45 GMT, December Comex gold is trading $1960.10, up $10.20 or +0.52%.
Daily Swing Chart Technical Analysis
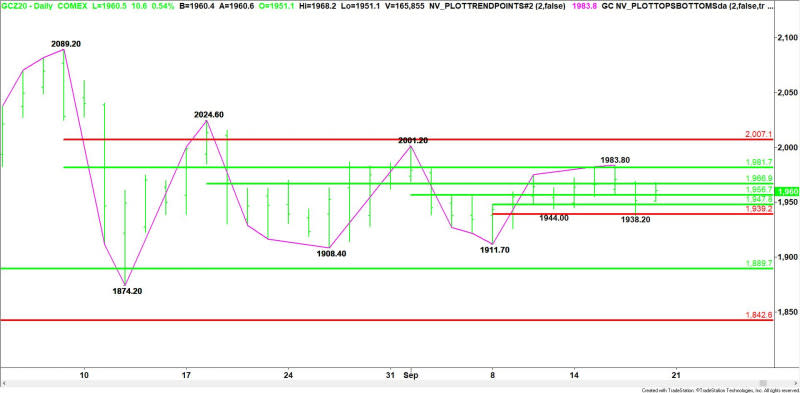
The main trend is up according to the daily swing chart. A trade through $2001.20 will signal a resumption of the uptrend. The main trend will change to down on a trade through $1911.70.
The minor trend is down. This is generating downside momentum. The minor trend will change to up on a more through $1983.80. Taking out $1938.20 will increase the downside momentum.
Short-Term Outlook
The market is currently being controlled by a series of 50% levels.
Resistance is coming in at $1966.90 and $1981.70. Support is being provided by 50% levels at $1956.70, $1947.80 and a Fibonacci level at $1939.20.
The trigger point for an upside breakout is $1983.80. On the downside, taking out $1938.20 could trigger an acceleration to the downside.
For a look at all of today’s economic events, check out our economic calendar.
This article was originally posted on FX Empire
More From FXEMPIRE:
E-mini S&P 500 Index (ES) Futures Technical Analysis – Trading on Weak Side of Resistance Area
Biden Widens the Gap as Swing State Fence Sitters Take a Stand
Crude Oil Weekly Price Forecast – Crude Oil Markets Recover for the Week
Silver Weekly Price Forecast – Silver Markets Form Neutral Candlestick
