
 Yahoo Finanza
 96% Of S&P 500 Stocks Show Upside Potential Vs. Street Estimates: Which Offers The Best Opportunity?

Ninety-six percent, or 480 out of the 500 companies comprising the S&P 500 index, are trading at lower market values compared to Wall Street analysts’ price targets, signaling abundant potential profit opportunities for investors.
Thus far, April has marked the bleakest month for the U.S. stock market since September 2023, with the S&P 500 index, tracked by the SPDR S&P 500 ETF Trust (NYSE:SPY), falling by 3.7%.
Across all 11 sectors constituting the index, only the Energy Select Sector SPDR Fund (NYSE:XLE) has managed to evade losses. The Real Estate Select Sector SPDR Fund (NYSE:XLRE) emerged as the month’s weakest performer, experiencing a 10% downturn.
Higher-than-expected inflation figures have placed downward pressure on stocks, leading to reduced expectations for Federal Reserve rate cuts. As of April 18, investors expect fewer than two rate cuts, down from over three anticipated at the beginning of the month.
Simultaneously, mounting geopolitical risks stemming from the ongoing Middle East crisis have amplified market uncertainties.
However, this phase of increased volatility has subdued the once prevalent bullish sentiment that persisted until the end of March, uncovering attractive opportunities for investors who favor buying the dips of undervalued stocks.
Presented herein are the top 5 contrarian stocks within the S&P 500 index exhibiting the most pronounced relative gap between current market prices and median price targets.
5. Carnival Corporation
Carnival Corp. (NYSE:CCL) has experienced a noticeable downturn, dropping by 11.54% this month and 22.03% year-to-date.
Analysts, however, have maintained consistency in their price forecasts. At the beginning of the year, the median target was $20.78, which has since held steady at $22.
This suggests a substantial 52.20% potential upside from the current trading price of $14.46 per share.
4. Bio-Rad Laboratories, Inc.
Bio-Rad Laboratories, Inc. (NYSE:BIO) has witnessed an 18.81% decline in price this month and a 13.03% decrease year-to-date.
Despite market fluctuations, the median price target has remained unchanged at $436.70 since the beginning of 2024.
Presently trading at $280.81 per share, this implies that analysts see a potential upside of 55.51% if the stock price converges with the target.
3. Warner Bros. Discovery, Inc.
Warner Bros. Discovery, Inc. (NASDAQ:WBD) has declined 5.27% this month and by a substantial 27.33% year-to-date.
Analysts have downwardly adjusted their price targets for WBD shares, reducing the median level from $16.64 at the beginning of the year to $13 presently.
Despite these downward revisions, the current share price of $8.27 still provides some margin of safety to investors, indicating a potential 57.19% upside if it converges with analysts’ targets.
2. Caesars Entertainment Inc.
Caesars Entertainment Inc. (NYSE:CZR) has declined by 11.25% month-to-date and a more substantial 17.19% year-to-date.
However, despite these negative trends, analysts have made minimal adjustments to their price targets for the casino-related company.
With the current trading price at $38.32, the median price target of $62.50 suggests a significant profit potential of 61% if the current price aligns with analysts’ expectations.
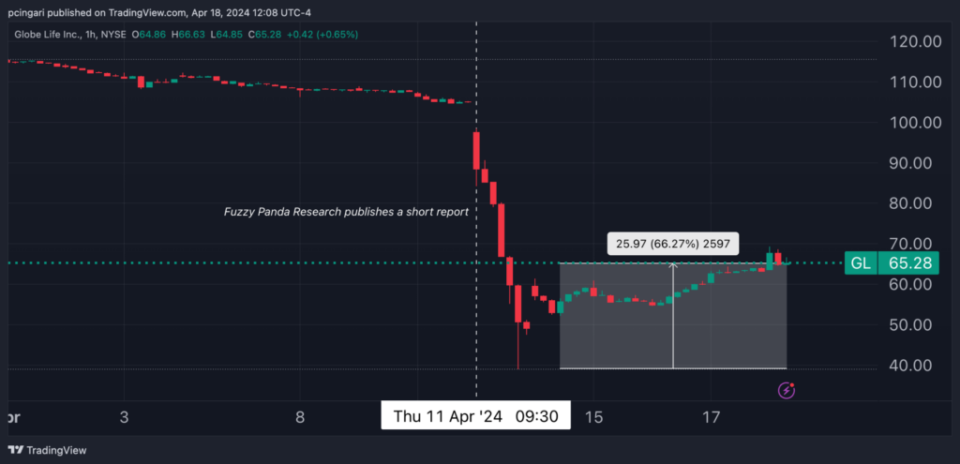
1. Globe Life Inc.
Globe Life Inc. (NYSE:GL) faced a tumultuous April, plummeting by a staggering 50% due to a critical report by short seller Fuzzy Panda Research.
Despite this, since hitting its lows on April 11, the shares have rebounded by 66%, though remaining still well below pre-report levels.
Despite a slight reduction in Wall Street analysts’ price targets, down from $136 to $130 in the past month, the current stock price of $64.98 presents an enticing short-squeeze opportunity, suggesting a profit potential of 100% if investors can counter and push back against Fuzzy Panda’s bearish pressure.
Chart: Will Globe Life Be Able To Squeeze Short Sellers?
Name | Price Target vs. Last Price | Last Price | Price Target – Median | Price Median 1Month Ago) | Price Target (2024 start) | Price Chg. % (MTD) | Price Chg. % (YTD) |
Globe Life Inc. | 100.05% | 64.98 | 130.00 | 136.00 | 133.56 | -44.16% | -46.61% |
Caesars Entertainment, Inc. | 61.00% | 38.82 | 62.50 | 63.00 | 62.33 | -11.25% | -17.19% |
Warner Bros. Discovery, Inc. | 57.19% | 8.27 | 13.00 | 13.20 | 16.64 | -5.27% | -27.33% |
Bio-Rad Laboratories, Inc. | 55.51% | 280.81 | 436.70 | 436.70 | 436.67 | -18.81% | -13.03% |
Carnival Corporation & plc | 52.20% | 14.46 | 22.00 | 22.00 | 20.78 | -11.54% | -22.03% |
Image generated using artificial intelligence via Midjourney.
"ACTIVE INVESTORS' SECRET WEAPON" Supercharge Your Stock Market Game with the #1 "news & everything else" trading tool: Benzinga Pro - Click here to start Your 14-Day Trial Now!
Get the latest stock analysis from Benzinga?
This article 96% Of S&P 500 Stocks Show Upside Potential Vs. Street Estimates: Which Offers The Best Opportunity? originally appeared on Benzinga.com
© 2024 Benzinga.com. Benzinga does not provide investment advice. All rights reserved.
