
 Yahoo Finanza
 E-mini Dow Jones Industrial Average (YM) Futures Technical Analysis – Buyers Facing Challenge at 32588 – 32927
June E-mini Dow futures are slightly lower during Wednesday’s pre-market session as investors hope to extend the current three-day rally. The move in the futures market came as the recent sell-off in stocks appears to have paused.
During the previous cash market session, the Dow rose 431 points, or 1.3%. Investors are also hoping the blue chip average can break its seven week losing streak.
At 04:20 GMT, June E-mini Dow futures are trading 32530, down 51 or -0.16%. On Tuesday, the SPDR Dow Jones Industrial Average ETF (DIA) settled at $327.04, up $4.26 or +1.32%.
Tuesday Recap
The E-mini Dow finished sharply higher on Tuesday, lifted by components Apple and Microsoft as megacap growth stocks posted solid gains. Apple gained 2.54% and Microsoft was up 2.03%.
Not everything was rosy, however. Walmart shares dropped over 11% after the big-box retailer reported quarterly earnings that significantly missed Wall Street’s expectations. Company officials cited cost pressures from rising fuel prices, higher inventory levels and overstaffing.
In economic news, investors were happy with data showing U.S. retail sales increased 0.9% in April as consumers bought motor vehicles amid an improvement in supply and frequented restaurants.
Daily Swing Chart Technical Analysis
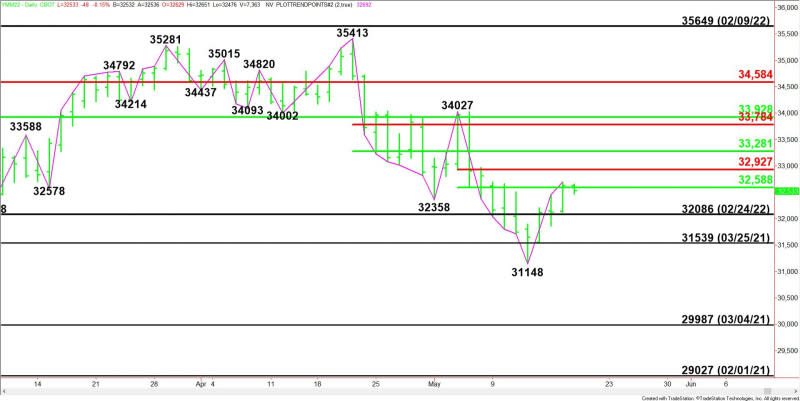
The main trend is down according to the daily swing chart. A trade through 31148 will signal a resumption of the downtrend while a move through 34027 will change the trend to up.
The short-term range is 34027 to 31148. The market is currently testing its retracement zone at 32588 to 32927.
The intermediate range is 35413 to 31148. Its retracement zone at 33281 to 33784 is potential resistance.
Daily Swing Chart Technical Forecast
Trader reaction to 32588 will determine the direction of the June E-mini Dow Jones Industrial Average early Wednesday.
Bullish Scenario
A sustained move over 32588 will indicate the presence of buyers. If this creates enough upside momentum then look for a surge into 32927. Sellers could come in on the first test of this level. Overtaking it, however, could trigger an acceleration into 33281.
Bearish Scenario
A sustained move under 32588 will signal the presence of sellers. If this move generates enough downside momentum then look for a minimum 50% correction of the rally from 31148 – 32651. This makes 31899 the nearest target. This level will move up if buyers take out 32651.
For a look at all of today’s economic events, check out our economic calendar.
This article was originally posted on FX Empire
More From FXEMPIRE:
Philippines’ Marcos wants China ties to ‘shift to higher gear’ under his presidency
Deutsche Bank to get tougher with suppliers over sustainability from July
Euro zone April inflation revised down to 7.4%; still a record high
Analysis-Elon Musk can’t easily give Twitter the boot over bots
Oil prices rise on China demand recovery expectations, supply concerns
