
 Yahoo Finanza
 E-mini NASDAQ-100 Index (NQ) Futures Technical Analysis – Trader Reaction to 12891.00 Sets the Weekly Tone
June E-mini NASDAQ-100 Index futures are trading lower shortly after the cash market close on Tuesday as investor dumped technology shares amid in jump in U.S. bond yields. Components Apple Inc, Microsoft Corp, Amazon.com and Broadcom Inc dropped between 0.9% and 2.7%, as the U.S. 10-year Treasury yield hit a 14-month high.
At 20:30 GMT, June E-mini NASDAQ-100 Index futures are trading 12892.50, down 52.00 or -0.40%.
The cash market NASDAQ Composite is set for its first weekly loss since November as a rise in yields since last month has particularly hit tech stocks which often have a low-rate environment heavily baked into their high valuations.
Daily Swing Chart Technical Analysis
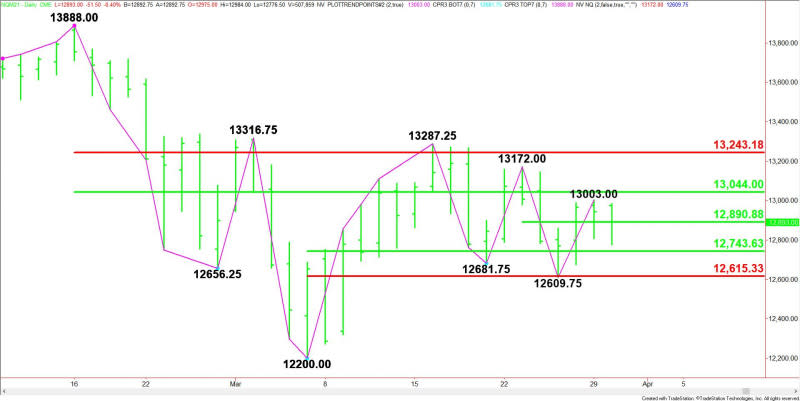
The main trend is down according to the daily swing chart. A trade through 12609.75 will signal a resumption of the downtrend. The main trend will change to up on a move through 13172.00.
The minor trend is also down. A trade through 13003.00 will change the minor trend to up. This will also shift momentum to the upside.
On the upside, the resistance zone is 13044.00 to 13243.25. This zone is controlling the near-term direction of the index.
On the downside, the support zone is 12743.50 to 12615.25. This zone is potential support and a possible trigger point for an acceleration to the downside.
The minor range is 13172 to 12609.75. The index is currently straddling its 50% level at 12891.00.
Short-Term Outlook
The price action this week suggests the direction of the June E-mini NASDAQ-100 Index the rest of the week will be determined by trader reaction to 12891.00.
Bullish Scenario
A sustained move over 12891.00 will indicate the presence of buyers. This could trigger a quick move into 13003.00, followed by 13044.00. Since the main trend is down, look for sellers on the first test of 13044.00. Taking it out, however, could trigger an acceleration to the upside with 13172.00 the first target, followed by 13243.25.
Bearish Scenario
A sustained move under 12890.75 will signal the presence of sellers. If this creates enough downside momentum then look for the selling to possibly extend into 12743.50 to 12615.25.
For a look at all of today’s economic events, check out our economic calendar.
This article was originally posted on FX Empire
