
 Yahoo Finanza
 Investors Who Bought Image Resources (ASX:IMA) Shares Five Years Ago Are Now Up 71%

Image Resources NL (ASX:IMA) shareholders might be concerned after seeing the share price drop 30% in the last quarter. But that doesn't change the fact that the returns over the last five years have been pleasing. After all, the share price is up a market-beating 71% in that time. Unfortunately not all shareholders will have held it for the long term, so spare a thought for those caught in the 39% decline over the last twelve months.
View our latest analysis for Image Resources
To paraphrase Benjamin Graham: Over the short term the market is a voting machine, but over the long term it's a weighing machine. By comparing earnings per share (EPS) and share price changes over time, we can get a feel for how investor attitudes to a company have morphed over time.
During the last half decade, Image Resources became profitable. That would generally be considered a positive, so we'd expect the share price to be up.
The image below shows how EPS has tracked over time (if you click on the image you can see greater detail).
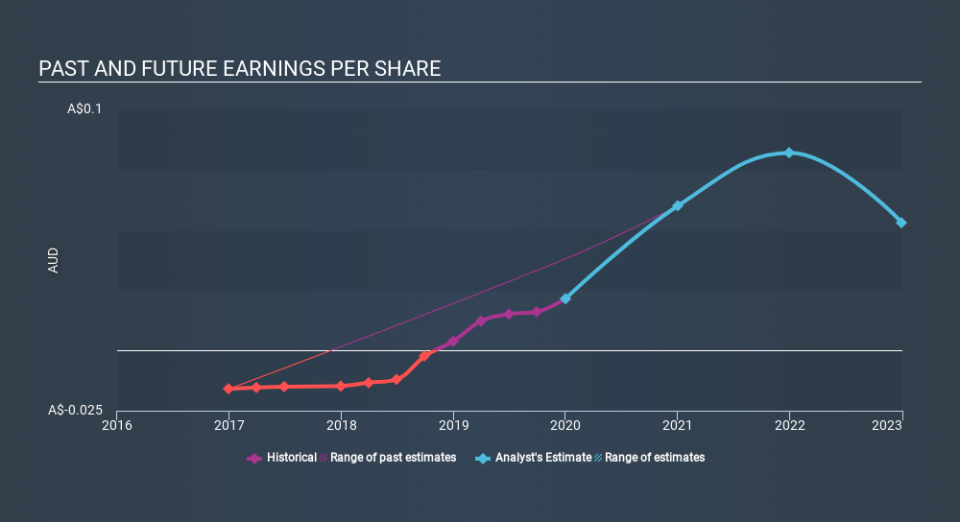
We consider it positive that insiders have made significant purchases in the last year. Having said that, most people consider earnings and revenue growth trends to be a more meaningful guide to the business. This free interactive report on Image Resources's earnings, revenue and cash flow is a great place to start, if you want to investigate the stock further.
What about the Total Shareholder Return (TSR)?
We'd be remiss not to mention the difference between Image Resources's total shareholder return (TSR) and its share price return. The TSR is a return calculation that accounts for the value of cash dividends (assuming that any dividend received was reinvested) and the calculated value of any discounted capital raisings and spin-offs. We note that Image Resources's TSR, at 80% is higher than its share price return of 71%. When you consider it hasn't been paying a dividend, this data suggests shareholders have benefitted from a spin-off, or had the opportunity to acquire attractively priced shares in a discounted capital raising.
A Different Perspective
While the broader market lost about 10% in the twelve months, Image Resources shareholders did even worse, losing 39%. Having said that, it's inevitable that some stocks will be oversold in a falling market. The key is to keep your eyes on the fundamental developments. On the bright side, long term shareholders have made money, with a gain of 12% per year over half a decade. It could be that the recent sell-off is an opportunity, so it may be worth checking the fundamental data for signs of a long term growth trend. While it is well worth considering the different impacts that market conditions can have on the share price, there are other factors that are even more important. Even so, be aware that Image Resources is showing 3 warning signs in our investment analysis , you should know about...
If you like to buy stocks alongside management, then you might just love this free list of companies. (Hint: insiders have been buying them).
Please note, the market returns quoted in this article reflect the market weighted average returns of stocks that currently trade on AU exchanges.
Love or hate this article? Concerned about the content? Get in touch with us directly. Alternatively, email editorial-team@simplywallst.com.
This article by Simply Wall St is general in nature. It does not constitute a recommendation to buy or sell any stock, and does not take account of your objectives, or your financial situation. We aim to bring you long-term focused analysis driven by fundamental data. Note that our analysis may not factor in the latest price-sensitive company announcements or qualitative material. Simply Wall St has no position in any stocks mentioned. Thank you for reading.
