
 Yahoo Finanza
 E-mini Dow Jones Industrial Average (YM) Futures Technical Analysis – Due for Short-Term Correction
December E-mini Dow Jones Industrial Average futures inched higher on Thursday after recovering from an early sell-off. The blue chip average was under pressure before the opening as a tumble in IBM shares weighed on the Dow, but managed to eke out a small gain as IBM recovered and a surge in Microsoft attracted new investors.
On Thursday, December E-mini Dow Jones Industrial Average futures settled at 35480, up 3 or +0.01%.
After hitting a new contract high the previous day the E-mini Dow was in the red for most of Thursday’s session as IBM fell 9.6% after missing Wall Street estimates for quarterly revenue as orders in one business segment declined ahead of a spinoff next month.
Daily Swing Chart Technical Analysis
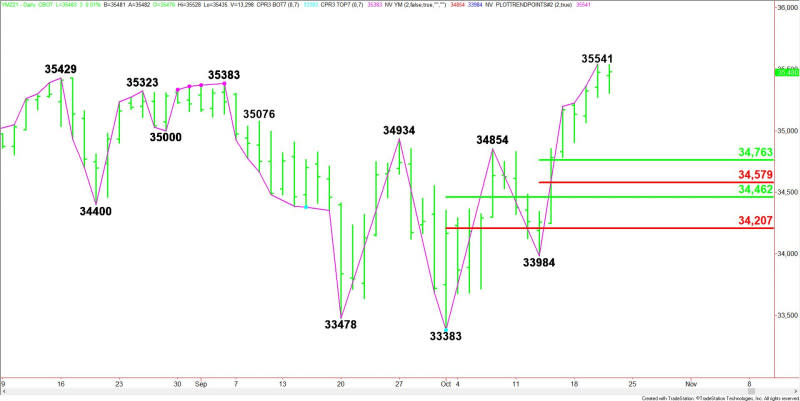
The main trend is up according to the daily swing chart. A trade through 35541 will signal a resumption of the uptrend.
A move through 33984 will change the main trend to down. This is highly unlikely, but Friday’s session will be the seventh day up from the last main bottom. This will put the E-mini Dow inside the window of time for a potentially bearish closing price reversal top.
The minor range is 33984 to 35541. Its retracement zone at 34763 to 34579 is the nearest support. This zone will move up as the Dow moves higher.
The short-term range is 33383 to 35541. Its retracement zone at 34462 to 34207 is the next support area and value zone.
Daily Swing Chart Technical Forecast
The direction of the December E-mini Dow early Friday is likely to be determined by trader reaction to 35480.
Bullish Scenario
A sustained move over 35480 will indicate the presence of buyers. Taking out 35541 will indicate the buying is getting stronger.
Bearish Scenario
A sustained move under 35480 will signal the presence of sellers. Taking out 35308 and 35272 will indicate the selling pressure is getting stronger. If this move generates enough downside momentum then look for the selling to possibly trigger an acceleration to the downside.
Closing Price Reversal Top Chart Pattern.
Taking out 35541 then closing below 35480 will form a potentially bearish closing price reversal top. This won’t change the main trend to down, but if confirmed, it could trigger the start of a 2 to 3 day correction.
For a look at all of today’s economic events, check out our economic calendar.
This article was originally posted on FX Empire
