
 Yahoo Finanza
 InterCure Announces Record Revenues First Half of 2023 with over 14% growth YOY

Half Year Revenues 2020 to 2023

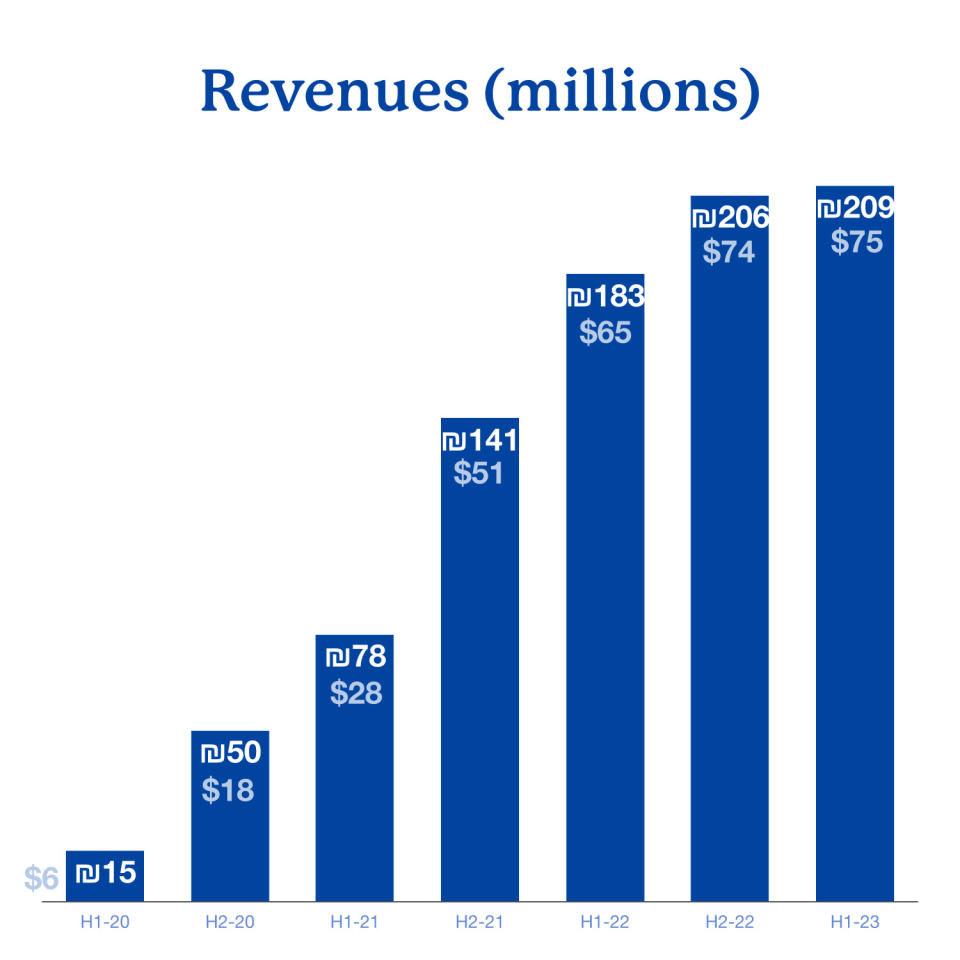
Achieved record revenues of NIS 209 million ($75 million)1 for the first half of 2023
Annualized revenue run rate of NIS 417 million ($149 million)
Adjusted EBITDA2 of NIS 30 million ($11 million)
Generated NIS 35 million ($13 million) cash from operations in the second quarter
Strong balance sheet with over NIS 116 million ($42 million) cash
and financial assets3 of NIS 71 million ($25 million)
NEW YORK and HERZLIYA, Israel, Aug. 31, 2023 (GLOBE NEWSWIRE) -- InterCure Ltd. (NASDAQ: INCR) (TASE: INCR) (dba Canndoc) ("InterCure" or the “Company”) is pleased to announce its financial and operating results for the six months ended June 30, 2023. All amounts are expressed in New Israeli Shekels (NIS) or Canadian dollars ($), unless otherwise noted.
Second Quarter and First Half 2023 Key Financial Highlights
Record revenue of NIS 209 million ($75 million) for first half of 2023 and NIS 102 ($36 million) for the second quarter of 2023, representing YOY growth of over 14% and 8% respectively.
Seventh consecutive half year growth representing an Annualized revenue run rate of NIS 417 million ($149 million).
Gross profit of NIS 68 million ($24 million), 33% of revenue, for first half of 2023 and NIS 33 million ($12 million), 32% of revenue for the second quarter.
EBITDA2 of NIS 30 million ($11 million) for first half of 2023, representing 14% of revenue and NIS 14 million ($5 million) for the second quarter.
Generated positive NIS 35 million ($13 million) cash from operations in the second quarter and a negative NIS 17 million ($6 million) for the first half.
Cash and restricted cash at period end of over NIS 116 million ($42 million) and financial assets3 of NIS 71 million ($25 million). As the interest rate environment is changing, we are constantly revising our financing structure. During the first half of 2023 we voluntarily repaid loans of NIS 86 million ($31 million).
Second Quarter and First Half 2023 Key Operating Highlights
Sustained market share growth during first half of 2023 due to solid demand for Canndoc's branded products with more than 20 new SKU's successful launches during the period marking InterCure’s leading position in all categories.
The cultivation operation successfully added 18 new highly demanded strains into its growth cycles. Including new high THC Humbolt cultivars. These are expected to launch during the third and fourth quarters.
Signing collaboration agreement (in the form of a license agreement) with legendary boxer, entrepreneur, and cannabis advocate Mike Tyson’s premium cannabis brand. Under the terms of the agreement, InterCure will be granted the right on exclusive basis to cultivate, manufacture, sell, market and distribute all approved products and brands of TYSON 2.0 In Israel, Germany, France, Australia and the United Kingdom. InterCure will also have the right to use the name, the marks and the TYSON 2.0 intellectual property in the said territories.
Announced a voluntary delisting of our ordinary shares from the Toronto Stock Exchange, due to the fact that maintaining the listing did not offer substantial benefits to InterCure and its shareholders. InterCure's shares continue to be traded on Nasdaq and the Tel Aviv Stock Exchange.
On August 7, 2023 the minister of health announced a new reform of the Israeli medical cannabis regulations. The new regulations are set to revolutionize the process of prescribing medical cannabis to patients by allowing physicians to prescribe medical cannabis as the first line of treatment (for the first time). In addition, the new regulations will eliminate bottlenecks that have been burdened the industry during the last years. This includes easing cultivation, manufacturing and exportation procedures and regulations. Additionally matching the GMP standards between Israel and Europe and transition to self-regulation similar to the Israeli pharmaceutical industry. The new reform also set a process for the introduction of new formats like vapes, edibles, extracts and other non-flower formats. Furthermore, the reform set a date of February 2024 to reschedule CBD out of the narcotic law which will allow CBD based products to be sold over the counter.
The new reform is expected to put into effect within the next coming months and it is expected to increase the number of patients and the demand for medical cannabis products after a long period of stagnation in the Israeli market. As we updated in the previous quarter, financially struggling companies and companies exiting the market continue to liquidize low-to-medium quality inventories at lower prices. This had an impact primarily on our ultra-medical and legacy products.
On June 15, 2023, Tel Aviv-Jaffa District Court dismissed the lawsuit against InterCure and the parties agreed on a binding arbitration process in which the amount owed to InterCure and the parties will be determined and paid as part of a full separation process. According to the company's position, Cannolam owes InterCure tens of NIS millions (which are not included in the financial assets mentioned) and InterCure's claim has been submitted to an arbitrator who is expected to rule within the next month. The separation process has a negative effect on the performance of Cannolam that could not be evaluated at this time, InterCure intends to exhaust its full rights against the minority shareholders of Cannolam. Previously, on April 24, 2023, a lawsuit was filed against InterCure in Tel Aviv-Jaffa District Court in Israel by minority shareholders of our subsidiary, Cannolam. The lawsuit relates to disagreements concerning the ongoing management of Cannolam. InterCure has conducted a preliminary review of the claims made by the minority shareholders and find that they lack a valid legal basis.
Commercial launches of our GMP products in UK and Germany expected during the fourth quarter of 2023 and the first quarter of 2024 as registration process are undergoing.
"First half of 2023 is another solid performance for InterCure, with year-over-year revenue growing 14% to $ million and adjusted EBITDA margin of 14%. I am proud of our team ability to execute despite some challenging market conditions when big players are exiting the space,” said InterCure CEO Alexander Rabinovitch. "In the second quarter we generated $31 million in operating cash flow and ended the quarter with $42 million of cash and $25 of financial assets on our balance sheet. We continue to optimize our operations for continued growth supported by our leading position. We are encouraged from the new regulations in Israel and Germany as pharmaceutical cannabis becoming a world standard across Europe and many other territories. We are also keeping an open eye on the U.S. Department of Health and Human Services scientific and medical evaluation, supporting cannabis to be classified as a Schedule III drug by the DEA and the opportunities it may generate to InterCure.”
Key Quarterly Financial Highlights – Cannabis Sector
| H1-23 | H2-22 | H1-22 | H2-21 | H1-21 |
Revenues | 208,614 | 206,178 | 182,506 | 141,396 | 78,281 |
Gross Profit (1) | 67,945 | 81,558 | 77,399 | 61,295 | 34,694 |
GP Margin | 33% | 40% | 42% | 43% | 44% |
Adjusted EBITDA(2) | 29,669 | 40,714 | 43,411 | 35,132 | 21,765 |
Adjusted EBITDA(2) Margin | 14% | 20% | 24% | 25% | 28% |
Notes | ||
(1) |
| Gross profit before effect of fair value. |
(2) |
| EBITDA adjusted for changes in the fair value of inventory, share-based payment expense, impairment losses (and gains) on financial assets, non-controlling interest and other expenses (or income). This is a non-IFRS financial measure and does not have a standardized meaning prescribed by IFRS, please see “Non-IFRS Measures” below. |
About InterCure (dba Canndoc)
InterCure (dba Canndoc) (NASDAQ: INCR) (TASE: INCR) is the leading, profitable, and fastest growing cannabis company outside of North America. Canndoc, a wholly owned subsidiary of InterCure, is Israel’s largest licensed medical cannabis producer and one of the first to offer Good Manufacturing Practices (GMP) certified and pharmaceutical-grade medical cannabis products. InterCure leverages its international market leading distribution network, best in class international partnerships and a high-margin vertically integrated "seed-to-sale" model to lead the fastest growing cannabis global market outside of North America.
For more information, visit: http://www.intercure.co.
Non-IFRS Measures
This press release makes reference to certain non-IFRS financial measures. Adjusted EBITDA, as defined by InterCure, means earnings before interest, income taxes, depreciation, and amortization, adjusted for changes in the fair value of inventory, share-based payment expense, impairment losses (and gains) on financial assets, non-controlling interest and other expenses (or income). This measure is not a recognized measure under IFRS, does not have a standardized meaning prescribed by IFRS and is therefore unlikely to be comparable to similar measures presented by other companies. InterCure’s method of calculating this measure may differ from methods used by other entities and accordingly, this measure may not be comparable to similarly titled measured used by other entities or in other jurisdictions. InterCure uses this measure because it believes it provides useful information to both management and investors with respect to the operating and financial performance of the company. A reconciliation of Adjusted EBITDA to an IFRS measure (revenue), which is incorporated by reference to this press release, is available in InterCure’s MD&A included in our Annual Report on Form 20-F under the heading “Results of Operation”, available under the Company’s profile on SEDAR at www.sedar.com.
Forward-Looking Statements
This press release may contain forward-looking statements. Forward-looking statements may include, but are not limited to, statements relating to InterCure’s objectives plans and strategies, as well as statements, other than historical facts, that address activities, events or developments that InterCure intends, expects, projects, believes or anticipates will or may occur in the future. These statements are often characterized by terminology such as “believes,” “hopes,” “may,” “anticipates,” “should,” “intends,” “plans,” “will,” “expects,” “estimates,” “projects,” “positioned,” “strategy” and similar expressions and are based on assumptions and assessments made in light of management’s experience and perception of historical trends, current conditions, expected future developments and other factors believed to be appropriate. Forward-looking statements are not guarantees of future performance and are subject to risks and uncertainties that could cause actual results to differ materially from those expressed or implied in such statements. Many factors could cause InterCure’s actual activities or results to differ materially from the activities and results anticipated in forward-looking statements, including, but not limited to, the following: the Company’s future revenue growth and profitability, the success of its global expansion plans, its continued growth, the expected operations, financial results business strategy, competitive strengths, goals and expansion and growth plans, expansion strategy to major markets worldwide, the impact of the COVID-19 pandemic and the war in Ukraine, macro economic factors (including inflation) and uncertainty created as a result of the socio-political situation in Israel. Forward-looking information is based on a number of assumptions and is subject to a number of risks and uncertainties, many of which are beyond InterCure’s control, which could cause actual results and events to differ materially from those that are disclosed in or implied by such forward-looking information. Such risks and uncertainties include, but are not limited to: changes in general economic, business and political conditions, changes in applicable laws, the U.S. regulatory landscapes and enforcement related to cannabis, changes in public opinion and perception of the cannabis industry, reliance on the expertise and judgment of senior management, as well as the factors discussed under the heading “Risk Factors” in InterCure’s Annual Information Form for the year ended December 31, 2022, which is available on SEDAR at www.sedar.com, and under the heading “Risk Factors” and “Cautionary Note Regarding Forward-Looking Statements” in the registration statement on Form 20-F, filed with the Securities Exchange Commission on May 1, 2023. InterCure undertakes no obligation to update such forward-looking information, whether as a result of new information, future events or otherwise, except as expressly required by applicable law.
Contact:
Amos Cohen, Chief Financial Officer (Amos@intercure.co)
1 All amounts are expressed in New Israeli Shekels (NIS) or Canadian Dollar ($).
2 Means EBITDA for the cannabis sector adjusted for changes in the fair value of inventory, share-based payment expense, impairment losses
(and gains) on financial assets, non-controlling interest and other expenses (or income).
3 Financial assets are mainly debts and loans included in other receivables.
CONDENSED CONSOLIDATED INTERIM FINANCIAL STATEMENTS | ||||
As of June 30, 2023 (Unaudited) | ||||
| ||||
Condensed Consolidated Interim Statements of Financial Position | ||||
| ||||
|
| For the 6-months ended on | ||
|
| NIS in thousands | ||
|
| 2023 |
| 2022 |
|
| (Unaudited) |
| (Audited) |
ASSETS |
|
|
|
|
|
|
|
|
|
CURRENT ASSETS: |
|
|
|
|
Cash and cash equivalents |
| 102,653 |
| 232,589 |
Restricted cash |
| 13,788 |
| 13,907 |
Trade receivables, net |
| 42,623 |
| 36,919 |
Other receivables |
| 91,747 |
| 97,375 |
Inventory |
| 136,443 |
| 120,133 |
Biological assets |
| 7,058 |
| 6,365 |
Financial assets measured at fair value through profit or loss |
| 192 |
| 205 |
Total current assets |
| 394,504 |
| 507,493 |
|
|
|
|
|
NON-CURRENT ASSETS: |
|
|
|
|
Property, plant and equipment and right-of-use asset |
| 96,970 |
| 103,133 |
Goodwill |
| 284,181 |
| 284,181 |
Deferred tax assets |
| 23,625 |
| 20,635 |
Financial assets measured at fair value through profit or loss |
| 2,565 |
| 2,565 |
Investment in associate and loan |
| 40,000 |
| 40,000 |
Total non-current assets |
| 447,341 |
| 450,514 |
|
|
|
|
|
TOTAL ASSETS |
| 841,845 |
| 958,007 |
|
|
|
|
|
|
|
|
|
|
|
|
|
|
|
LIABILITIES AND EQUITY |
|
|
|
|
|
|
|
|
|
CURRENT LIABILITIES: |
|
|
|
|
Short term loan and current maturities |
| 56,521 |
| 126,935 |
Trade payables |
| 104,605 |
| 126,067 |
Other payables |
| 39,524 |
| 48,397 |
Contingent consideration |
| 6,145 |
| 10,230 |
Short term loan from non-controlling interest |
| 957 |
| 1,090 |
Total current liabilities |
| 207,752 |
| 312,719 |
|
|
|
|
|
LONG-TERM LIABILITIES: |
|
|
|
|
Long term loans |
| 84,067 |
| 99,684 |
Liabilities in respect of employee benefits |
| 1,079 |
| 1,025 |
Lease liability |
| 21,295 |
| 23,102 |
Total long-term liabilities |
| 106,441 |
| 123,811 |
|
|
|
|
|
EQUITY: |
|
|
|
|
Share capital, premium and other reserves |
| 634,383 |
| 632,025 |
Capital reserve for transactions with controlling shareholder |
| 2,388 |
| 2,388 |
Receipts on account of shares |
| 8,541 |
| 8,541 |
Accumulated losses |
| (136,552) |
| (141,649) |
Equity attributable to owners of the Company |
| 508,760 |
| 501,305 |
|
|
|
|
|
Non-controlling interests |
| 18,892 |
| 20,172 |
TOTAL EQUITY |
| 527,652 |
| 521,477 |
|
|
|
|
|
TOTAL LIABILITIES AND EQUITY |
| 841,845 |
| 958,007 |
Condensed Consolidated Interim Statements of Profit or Loss and Other Comprehensive Income | ||||||
| ||||||
|
| For the 6-months ended on |
| Year ended | ||
|
| NIS in thousands | ||||
|
| 2023 |
| 2022 |
| 2022 |
|
| (Unaudited) |
| (Unaudited) |
| (Audited) |
|
|
|
|
|
|
|
|
|
|
|
|
|
|
|
|
|
|
|
|
|
Revenue |
| 208,614 |
| 182,506 |
| 388,684 |
Cost of revenue before fair value adjustments |
| 140,669 |
| 105,107 |
| 229,727 |
|
|
|
|
|
|
|
Gross income before impact of changes in fair value |
| 67,945 |
| 77,399 |
| 158,957 |
|
|
|
|
|
|
|
Unrealized changes to fair value adjustments of biological assets |
| 4,339 |
| 7,881 |
| 13,054 |
Loss from fair value changes realized in the current year |
| 5,316 |
| 2,270 |
| 16,928 |
|
|
|
|
|
|
|
Gross Profit |
| 66,968 |
| 83,010 |
| 155,083 |
|
|
|
|
|
|
|
Research and development expenses |
| 256 |
| 338 |
| 632 |
General and administrative expenses |
| 21,856 |
| 16,958 |
| 36,082 |
Sales and marketing expenses |
| 27,800 |
| 24,112 |
| 56,533 |
Other expenses, net |
| 2,919 |
| 1,124 |
| 2,128 |
Changes in the fair value of financial assets through profit or loss, net. |
| 12 |
| 123 |
| 174 |
Share based payments |
| 2,358 |
| 2,441 |
| 8,907 |
|
|
|
|
|
|
|
Operating Profit |
| 11,767 |
| 37,914 |
| 50,627 |
|
|
|
|
|
|
|
|
|
|
|
|
|
|
Financing income |
| 2,252 |
| 8,805 |
| 8,170 |
Financing expenses |
| 11,842 |
| 6,099 |
| 14,955 |
|
|
|
|
|
|
|
Financing expenses (income), net |
| 9,590 |
| (2,706) |
| 6,785 |
|
|
|
|
|
|
|
Profit before tax on income |
| 2,177 |
| 40,620 |
| 43,842 |
|
|
|
|
|
|
|
Tax (expense) benefit |
| 1,640 |
| (10,445) |
| (93) |
Total comprehensive Profit (loss) |
| 3,817 |
| 30,175 |
| 43,749 |
|
|
|
|
|
|
|
Profit (loss) attributable to: |
|
|
|
|
|
|
Owners of the Company |
| 5,097 |
| 29,012 |
| 44,819 |
Non-controlling interests |
| (1,280) |
| 1,163 |
| (1,070) |
Total |
| 3,817 |
| 30,175 |
| 43,749 |
|
|
|
|
|
|
|
Interest / Financing expense (income) net |
| 9,590 |
| (2,706) |
| 6,785 |
Tax expenses (benefit) |
| (1,640) |
| 10,445 |
| 93 |
Depreciation and amortization |
| 6,442 |
| 4,629 |
| 2,354 |
EBITDA |
| 18,209 |
| 42,543 |
| 52,981 |
Share-based payment expenses |
| 2,358 |
| 2,441 |
| (2,004) |
Other expenses (income), net |
| 2,919 |
| 1124 |
| 2128 |
Impairment losses and (gains) on financial assets through profit and loss |
| 12 |
| 123 |
| 174 |
Fair value adjustment to inventory |
| 977 |
| (5611) |
| (3527) |
Adjusted EBITDA |
| 24,475 |
| 40,620 |
| 49,752 |
|
|
|
|
|
|
|
Earnings per share |
|
|
|
|
|
|
Basic earnings |
| 0.11 |
| 0.64 |
| 0.99 |
Diluted earnings |
| 0.11 |
| 0.64 |
| 0.99 |
|
|
|
|
|
|
|
A photo accompanying this announcement is available at https://www.globenewswire.com/NewsRoom/AttachmentNg/9a1af83a-5314-467a-880c-5d2311ec3760

