
 Yahoo Finanza
 E-mini NASDAQ-100 Index (NQ) Futures Technical Analysis – Sellers Dumping Inflation-Sensitive Growth Stocks
September E-mini NASDAQ-100 Index futures finished lower on Thursday, posting a steep loss as investors expressed concerns ahead of Friday’s U.S. consumer inflation report by dumping inflation-sensitive high-growth stocks. The sell-off was broad-based with the communication services sector down the most.
On Thursday, the September E-mini NASDAQ-100 Index settled at 12646.00, down 96.25 or -0.76%. The Invesco QQQ Trust ETF (QQQ) closed at $299.28, down $8.36 or -2.72%.
The headline data is expected to show that consumer prices rose 0.7% in May, while the core consumer price index (CPI), which excludes the volatile food and energy sectors, rose 0.5% in the month.
Tech investors are worried that rising inflation could keep the Federal Reserve on an aggressive path in raising interest rates. This would be bearish for stocks. However, we could see a bullish reaction even if the headline number is high and the core inflation data is flat.
Daily Swing Chart Technical Analysis
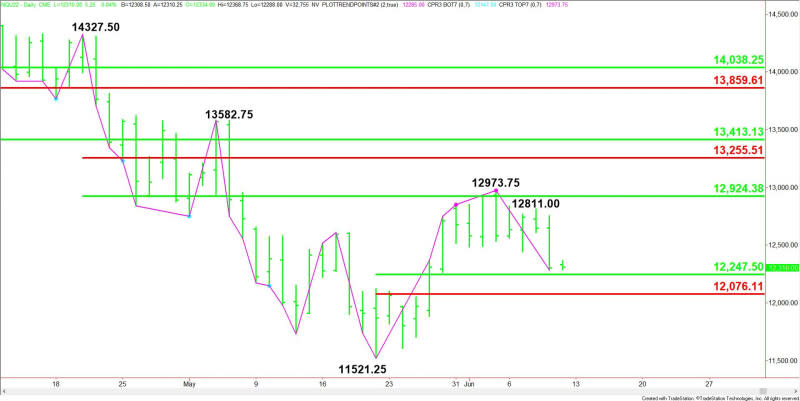
The main trend is up according to the daily swing chart. However, momentum is trending lower. A trade through 12973.75 will signal a resumption of the uptrend. A trade through 11521.25 will change the main trend to down.
The minor trend is down. This is controlling the momentum. A trade through 12811.00 will change the minor trend to up.
The intermediate range is 14327.50 to 11521.25. Its retracement zone at 12924.50 is resistance. It stopped the buying on June 3.
The short-term range is 11521.25 to 12973.75. Its retracement zone at 12247.50 to 12076.00 is the primary downside target.
Short-Term Outlook
Trader reaction to 12247.50 to 12076.00 is likely to determine the near-term direction of the September E-mini NASDAQ-100 Index.
Since the main trend is up, look for buyers on the first test of 12247.50 to 12076.00. They are going to try to form a potentially bullish secondary higher bottom.
Bearish sellers are going to try to drive the index through the lower or Fibonacci level at 12076.00. This could trigger an acceleration to the downside with the main bottom at 11521.25 the next major target price.
For a look at all of today’s economic events, check out our economic calendar.
This article was originally posted on FX Empire
