
 Yahoo Finanza
 April Comex Gold Reaction to $1840.70 Sets the Tone
Gold futures are edging higher on Monday, supported by a drop in U.S. Treasury yields. Gains are likely being limited by a stronger U.S. Dollar. Investors seeking protection are buying the true safe-haven markets – U.S. Treasurys and the dollar. The catalysts behind the moves are caution over the escalating tensions in Ukraine and a widely anticipated hawkish lean by the Federal Reserve on Wednesday.
At 12:43 GMT, April Comex gold futures are trading $1841.50, up $7.40 or +0.40%. On Friday, the SPDR Gold Shares ETF (GLD) settled at $171.08, down $0.57 or -0.33%.
Despite the mixed signals being generated by lower yields and a higher U.S. Dollar, gold remains just under last week’s two-month high, which puts it in a position to breakout to the upside.
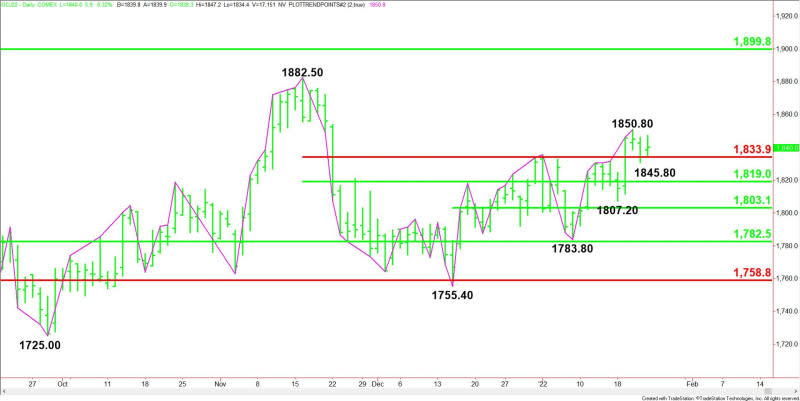
Daily Swing Chart Technical Analysis
The main trend is up according to the daily swing chart. A trade through $1850.80 will single a resumption of the uptrend. A move through $1783.80 will change the main trend to down.
The minor trend is also up. A trade through $1845.80 will change the minor trend to down. This will shift momentum to the downside.
The short-term range is $1882.50 to $1755.40. The market is currently trading on the strong side of its retracement zone at $1833.90 to $1819.00, making it new support.
The minor range is $1755.40 to $1850.80. Its 50% level at $1807.20 is additional support.
The main support zone is $1782.50 to $1758.80.
Daily Swing Chart Technical Forecast
The direction of the April Comex gold futures contract on Monday is likely to be determined by trader reaction to $1833.90.
Bullish Scenario
A sustained move over $1833.90 will indicate the presence of buyers. If this creates enough upside momentum then look for a surge into $1850.80.
Taking out $1850.80 will signal a resumption of the uptrend. This could trigger an acceleration to the upside with the November 26 main top at $1882.50 the next major target.
Bearish Scenario
A sustained move under $1833.90 will signal the presence of sellers. Taking out $1845.80 will change the minor trend to down. This could trigger a further break into $1819.00.
Look for a technical bounce on the first test of $1819.00, but if it fails then look for the selling to extend into the support cluster at $1807.20 to $1803.10.
For a look at all of today’s economic events, check out our economic calendar.
This article was originally posted on FX Empire
