
 Yahoo Finanza
 Should You Be Tempted To Sell Steve Leung Design Group Limited (HKG:2262) Because Of Its P/E Ratio?

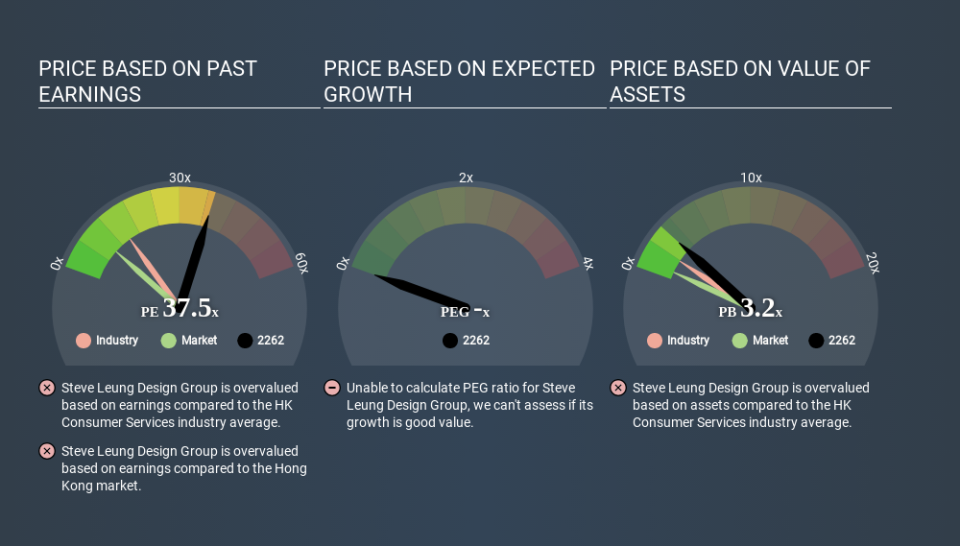
The goal of this article is to teach you how to use price to earnings ratios (P/E ratios). We'll look at Steve Leung Design Group Limited's (HKG:2262) P/E ratio and reflect on what it tells us about the company's share price. Steve Leung Design Group has a P/E ratio of 37.46, based on the last twelve months. That is equivalent to an earnings yield of about 2.7%.
Check out our latest analysis for Steve Leung Design Group
How Do I Calculate A Price To Earnings Ratio?
The formula for P/E is:
Price to Earnings Ratio = Price per Share ÷ Earnings per Share (EPS)
Or for Steve Leung Design Group:
P/E of 37.46 = HK$1.270 ÷ HK$0.034 (Based on the trailing twelve months to December 2019.)
(Note: the above calculation results may not be precise due to rounding.)
Is A High P/E Ratio Good?
A higher P/E ratio means that investors are paying a higher price for each HK$1 of company earnings. That isn't a good or a bad thing on its own, but a high P/E means that buyers have a higher opinion of the business's prospects, relative to stocks with a lower P/E.
How Does Steve Leung Design Group's P/E Ratio Compare To Its Peers?
One good way to get a quick read on what market participants expect of a company is to look at its P/E ratio. The image below shows that Steve Leung Design Group has a higher P/E than the average (15.2) P/E for companies in the consumer services industry.
That means that the market expects Steve Leung Design Group will outperform other companies in its industry. The market is optimistic about the future, but that doesn't guarantee future growth. So further research is always essential. I often monitor director buying and selling.
How Growth Rates Impact P/E Ratios
When earnings fall, the 'E' decreases, over time. That means even if the current P/E is low, it will increase over time if the share price stays flat. So while a stock may look cheap based on past earnings, it could be expensive based on future earnings.
Steve Leung Design Group saw earnings per share decrease by 41% last year. And EPS is down 3.5% a year, over the last 5 years. This might lead to muted expectations.
Don't Forget: The P/E Does Not Account For Debt or Bank Deposits
It's important to note that the P/E ratio considers the market capitalization, not the enterprise value. Thus, the metric does not reflect cash or debt held by the company. In theory, a company can lower its future P/E ratio by using cash or debt to invest in growth.
Such spending might be good or bad, overall, but the key point here is that you need to look at debt to understand the P/E ratio in context.
How Does Steve Leung Design Group's Debt Impact Its P/E Ratio?
With net cash of HK$240m, Steve Leung Design Group has a very strong balance sheet, which may be important for its business. Having said that, at 16% of its market capitalization the cash hoard would contribute towards a higher P/E ratio.
The Verdict On Steve Leung Design Group's P/E Ratio
Steve Leung Design Group trades on a P/E ratio of 37.5, which is multiples above its market average of 9.3. The recent drop in earnings per share might keep value investors away, but the healthy balance sheet means the company retains the potential for future growth. If this growth fails to materialise, the current high P/E could prove to be temporary, as the share price falls.
Investors have an opportunity when market expectations about a stock are wrong. People often underestimate remarkable growth -- so investors can make money when fast growth is not fully appreciated. We don't have analyst forecasts, but shareholders might want to examine this detailed historical graph of earnings, revenue and cash flow.
But note: Steve Leung Design Group may not be the best stock to buy. So take a peek at this free list of interesting companies with strong recent earnings growth (and a P/E ratio below 20).
Love or hate this article? Concerned about the content? Get in touch with us directly. Alternatively, email editorial-team@simplywallst.com.
This article by Simply Wall St is general in nature. It does not constitute a recommendation to buy or sell any stock, and does not take account of your objectives, or your financial situation. We aim to bring you long-term focused analysis driven by fundamental data. Note that our analysis may not factor in the latest price-sensitive company announcements or qualitative material. Simply Wall St has no position in any stocks mentioned. Thank you for reading.
